Movebank Acceleration Viewer User Manual
The Movebank Acceleration Viewer has tools for viewing and analyzing acceleration and GPS data acquired by e-obs telemetry tags. This software is no longer supported. These instructions may continue to work, depending on your operating system. This software has been superceded by the Firetail program.
Prerequisites
The Acceleration Viewer is written in the Java programming language. To launch the application you need a current version of the Java Runtime Environment (JRE) installed on your computer.
Since the Acceleration Viewer uses Java WebStart technology (included with JRE) there is no need for an extra installation step to run the application.
The application can show GPS positions on a built-in mapping solution. This solution uses NASA World Wind for visualizing the earth. NASA World Wind uses the OpenGL graphic standard for drawing. You may need to check for necessary video card drivers. Please have a look at this page if you encounter any problems with NASA World Wind or OpenGL.
The Acceleration Viewer should run on these operating systems:
- 32- and 64-bit Windows systems (tested on Windows XP and Windows 7)
- 64-bit Linux systems (tested on Arch Linux and Ubuntu 10.04)
- 64-bit Mac OSX (not fully tested)
Open the program
The Acceleration Viewer program includes one file, movebank-acceleration-viewer.jnlp (or something similar). Store the file in a place you will be able to find it again. If you do not have the required version of Java installed on your computer, you might be prompted automatically to update your software.
Double click on the file to start the program.
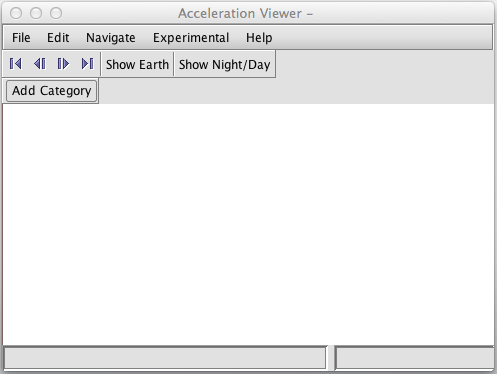
If the Acceleration Viewer launched successfully, you will see a window similar to this one:
Download data from Movebank
To access data from Movebank in the Acceleration Viewer,
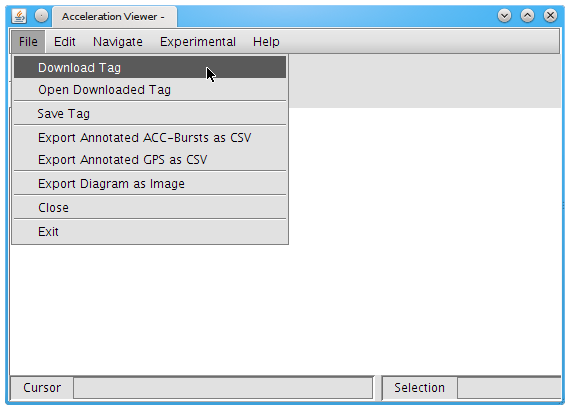
- go to File > Download Data by Tag ID. In more recent versions, you can also choose to download data by Individual (Animal) ID or Deployment ID.
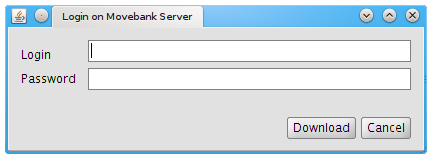
- Enter your Movebank username (login) and password and click on Download.
If your login attempt was successful, a list of all Movebank studies for which you have permission to view some or all of the data will appear. This may take a few moments.
Note: Currently this list includes studies that you do not have the necessary Permissions to download, and studies that do not contain acceleration data, so the title Your Studies is misleading. This will be fixed in a future release. In the meantime, if you choose one of these inaccessible studies, you will receive a message explaining this. If you do not have access to data in a study, you can request that the owner add you as a Data Manager or Collaborator for the study.

-
Select a study. In this example I will select “Lake Constance Ducks new”. The “id #2927282″ text that is appended to the study name is Movebank's internal identification number for the study. You can ignore it.
-
Select OK to continue the download.
-
A dialog may appear that tells you the terms of use of this study. To continue with the download you must accept the license terms. For example, the terms of use for the “Lake Constance Ducks new” study looks like this:
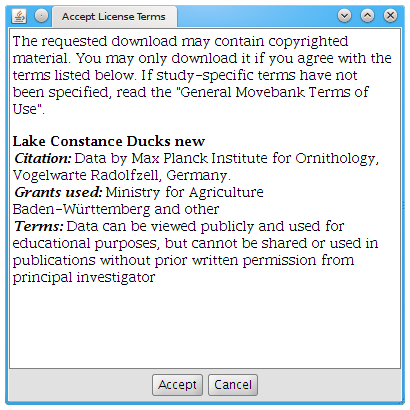
- If you are unsure whether your use of the data complies with the terms of use, contact the data owner. Otherwise, hit Accept.
In a moment a list of all available Tag/Animal/Deployment IDs in the study will appear. Again, internal Movebank identification numbers will be appended after the names—you can ignore them.
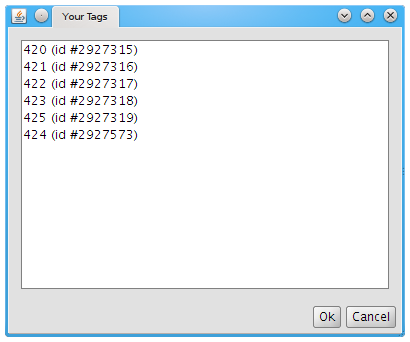
- Select the entity that you want to download and click on OK.

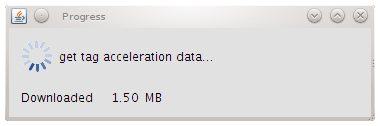
The download progress dialog will appear.
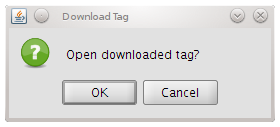
- Once the download completes, this dialog will appear. (If the download failed, see the note above.) Select OK to open and view the newly downloaded data in the Acceleration Viewer.
The downloaded acceleration data will appear in the main window of the application.
View acceleration data
To view acceleration data in the Acceleration Viewer, go to File > Open downloaded data. You will see a list of entity IDs you have already downloaded data for. (If no data are available, see Download data from Movebank above.)
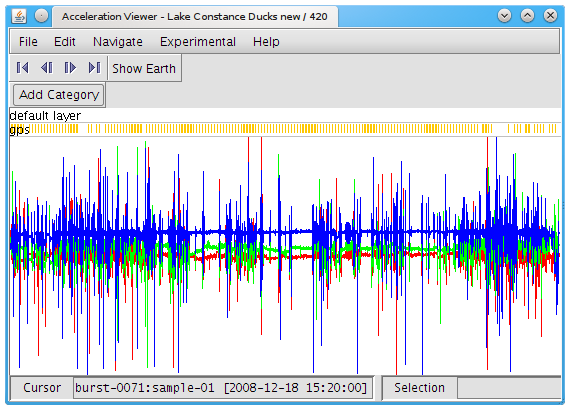
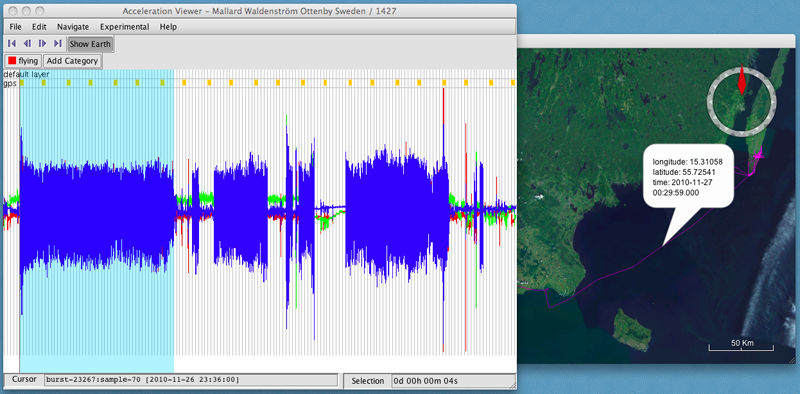
Select the entity you want to view and click Open. In this example, we see data for a wild duck (Anas platyrhynchos) collected by researchers at Linnaeus University and Max Planck Institute for Ornithology (Waldenström et al. unpublished).
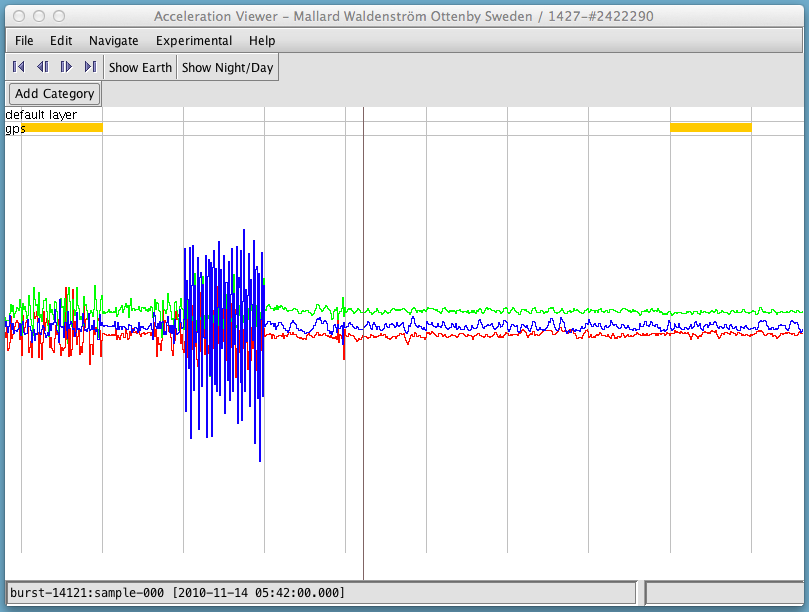
The entire set of data are displayed as a graph in the window, showing acceleration over time. The jagged lines taking up most of the screen are the acceleration data, with one color for each axis: red is X, green is Y, and blue is Z. (The orientation of each axis depends on how the tag was attached to the animal.) The golden bars at the top mark when GPS fixes were taken.
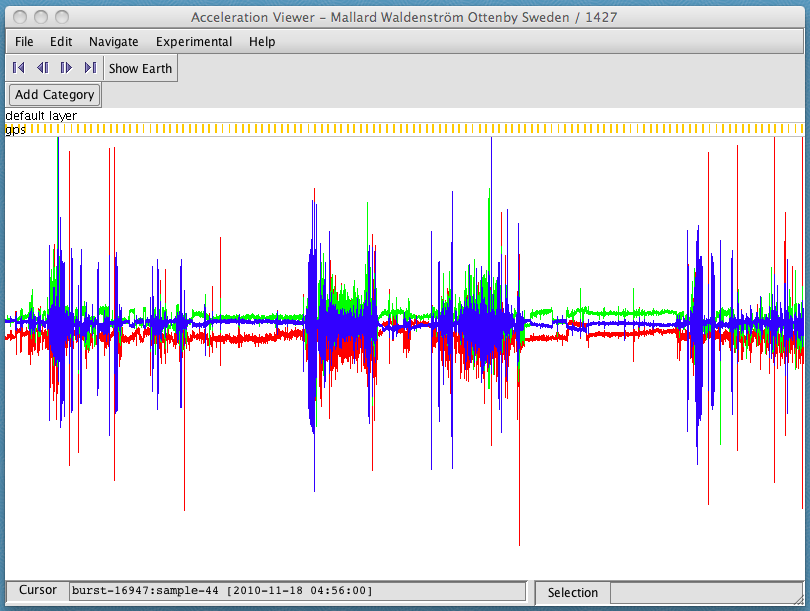
To see the data in more detail, you can zoom in and out in time by scrolling with your mouse, and move forward or backward in time by putting your cursor on the image, holding down the left mouse key, and dragging the cursor to the left or right. Once you zoom in far enough, you will be able to see individual bursts (separated by vertical gray lines) and samples within the burst. As you move the cursor over the window (without clicking), the sample number and the time it was recorded (in UTC) will be displayed in the lower left corner.
View GPS data
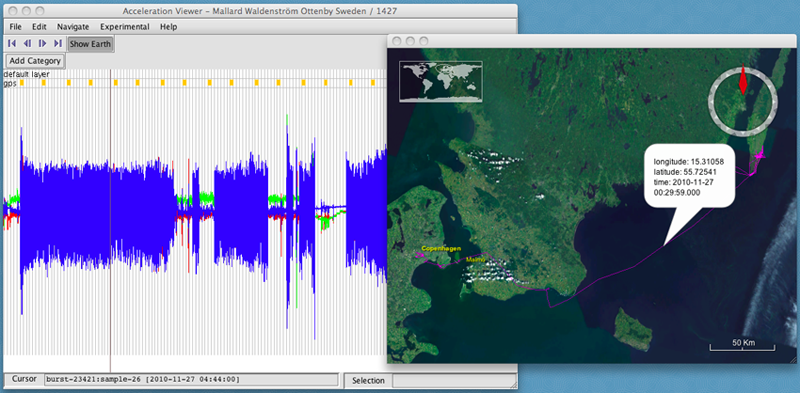
The next obvious step is to see where the animal was as the acceleration data were recorded. To do this,
- select Show Earth. A new window will open displaying the track on a map with satellite imagery.
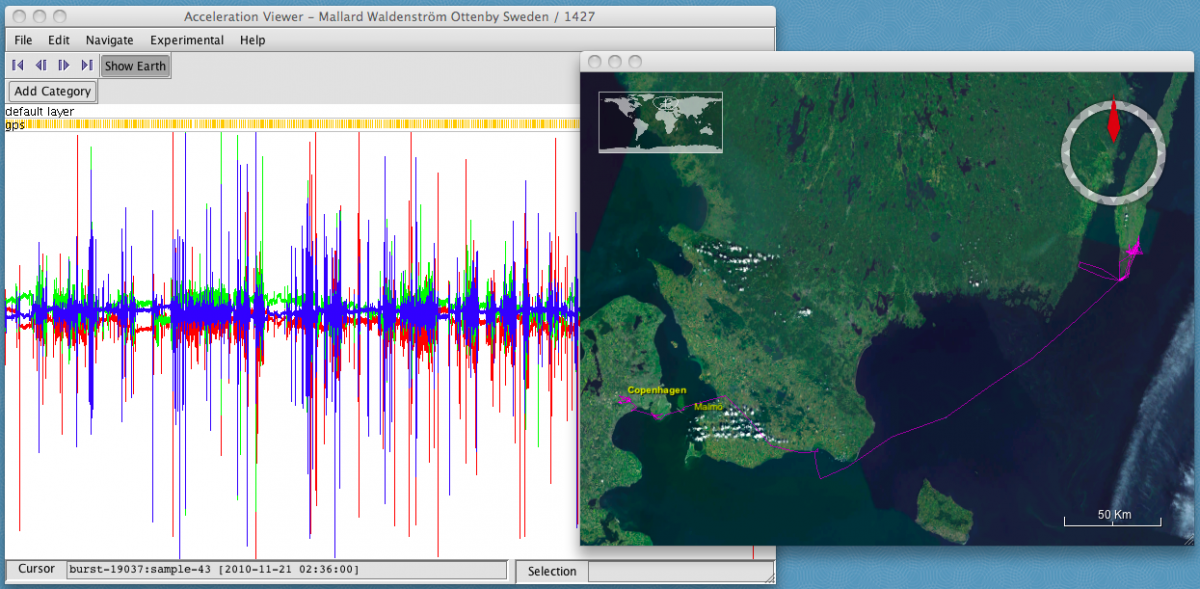
- Click on an interesting part of the acceleration data. The map will display the location, coordinates, and time of the nearest GPS fix.
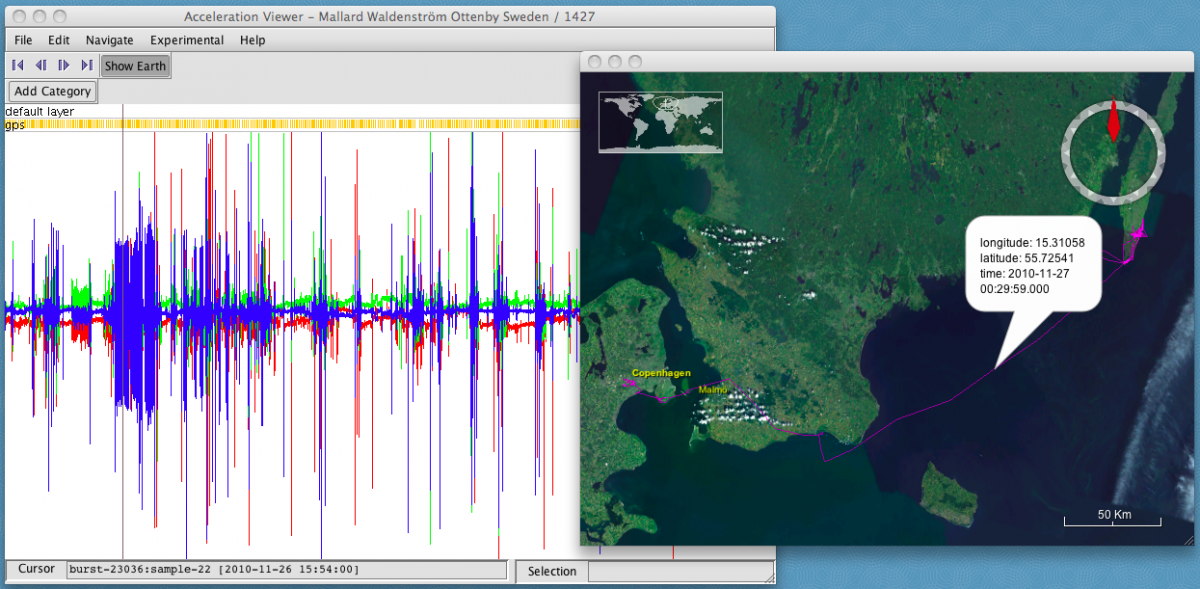
- Use the arrow icons below the menu (also located under Navigate) to jump between GPS fixes. You can also click along the track on the map to jump to the corresponding acceleration data.
View daytime and nighttime
It can be helpful to see whether data were collected during the day or night (remember that all the timestamps shown are in UTC and not local time, which could change as the animal moves).
Click on Show Night/Day. The Acceleration Viewer determines night and day by calculating the solar elevation angle for each GPS fix, and assigning negative angles as night and positive angles as day. The graph will be shaded in purple where nighttime GPS fixes were recorded, and a new window will open with a table of the results.
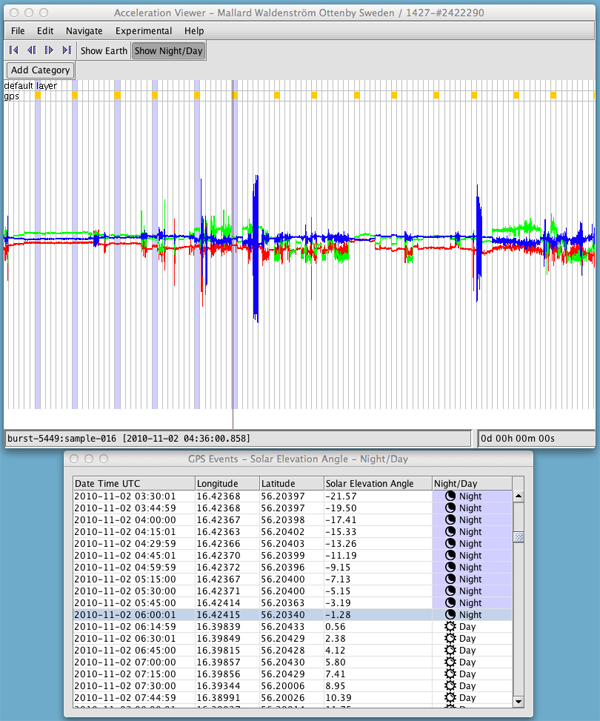
You can click on a table row to jump to a GPS fix in the graph, or click on the graph to jump to the corresponding row in the table.
Annotate acceleration data
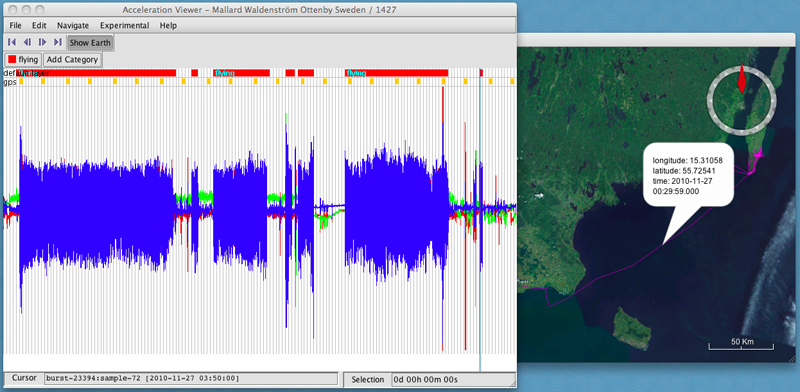
You may want to assign sections of the data to certain categories, for example distinct behaviours. You can do this in the Acceleration Viewer by defining categories and annotating the data with them.
In our example, the sections with large acceleration values along the Z axis (in blue) were measured when the bird was flying. You can annotate those sections of data from when the bird was flying to help with analysis.
- First, create a new category by clicking on Add Category.
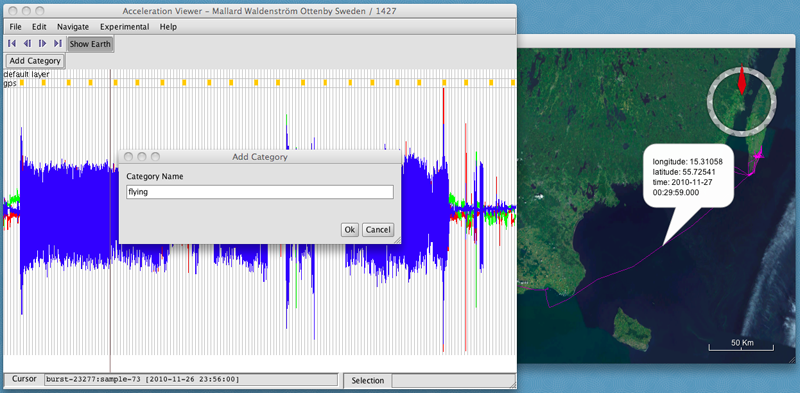
- Enter the category name,
- Click OK. I'll call this one "flying". A new button will appear assigning a name and color to the new category.
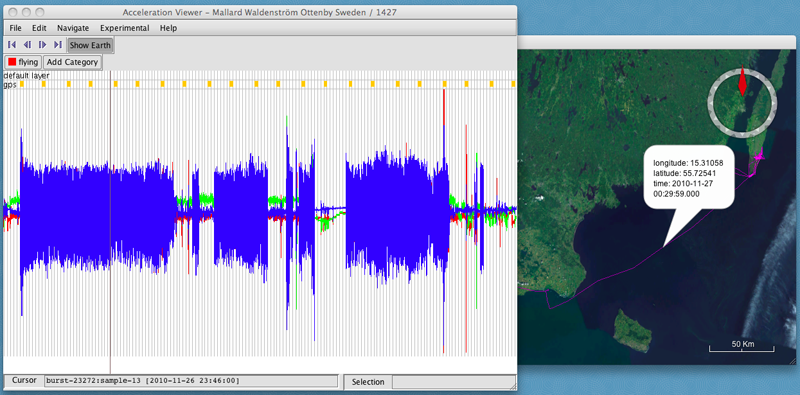
- Hold down the shift key while dragging your cursor over the graph to select a section of data that you want to assign to the new category.
- Click on the category's button ("flying") to annotate that category to the selected data.
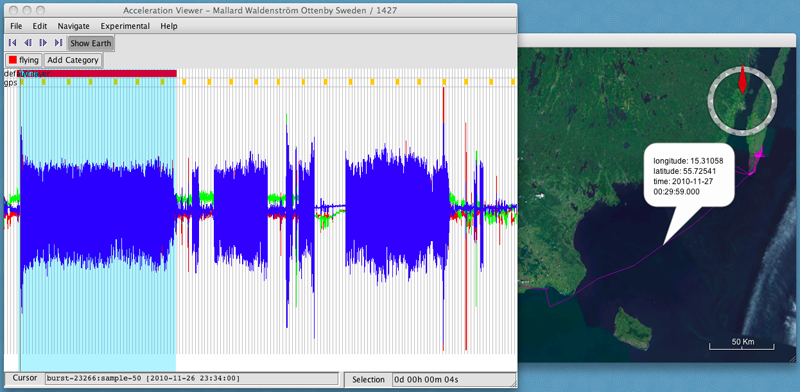
- Repeat this by adding new categories and annotating more of the data.
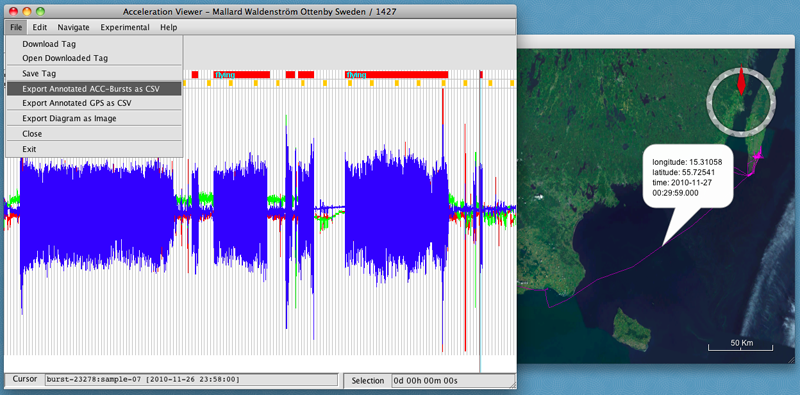
- When you are finished, you can export a csv file of your annotated data by selecting File > Export Annotated ACC-Bursts as CSV or Export Annotated GPS as CSV.
Experimental features
There are a few additional tools in the Acceleration Viewer that are considered experimental (in Beta stage).
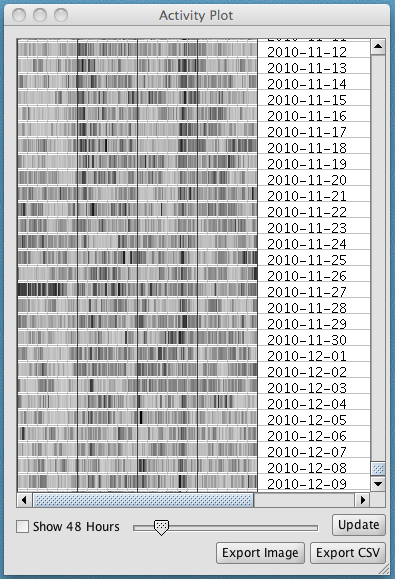
Create activity plot
The activity plot provides an alternative way to view the acceleration data that is helpful for identifying daily or 2-day activity patterns. To create an activity plot, select Experimental > Create activity plot. Read the Firetail manual for further description of methods.
The plot shows a summary of the data over 24-hour periods (or, click on Show 48 hours to view in 2-day periods).
Export ODBA
ODBA is the abbreviation for “overall dynamic body acceleration”. Select Experimental > Export ODBA to export a csv file containing the raw acceleration burst data along with calculated ODBA. Read the Firetail manual for further description of methods.
The following steps are applied to calculate the ODBA value for a burst of raw acceleration data from an e-obs tag:
- Calculate the static value per burst.
- Subtract the static value from the measurement, take the absolute value, and sum them up.
Then the following calculation is performed for each burst ‘B’, where
- ‘B’ is the burst with n samples.
- ‘x(1..n)’, ‘y(1..n)’ and ‘z(1..n)’ are the x, y and z components of all of the acceleration samples in the burst.
- ‘sum’ is Σ with i=1 to n.
xmean = sum( x(i) ) / n
ymean = sum( y(i) ) / n
zmean = sum( z(i) ) / n
ODBA(B) = sum(|x(i)-xmean|) + sum(|y(i)-ymean|) + sum(|z(i)-zmean|)
View heart rate (ECG) data
If your e-obs tags include heart rate sensors, you can open and view the data collected by selecting Experimental > Open Ecg file. You can then export these data in csv format by selecting Experimental > Export heart rate as CSV.