ECODATA
The Environmental COntextual-Data And TrAck (ECODATA) Prepare and Animate apps are free tools to support data exploration and analysis:
- ECODATA-Prepare processes remote sensing data and shapefiles with Python for subsequent analysis, and compiles image frames into animations.
- ECODATA-Animate is a MATLAB® App that visualizes data prepared by ECODATA-Prepare to visualize animal movements with environmental background layers.
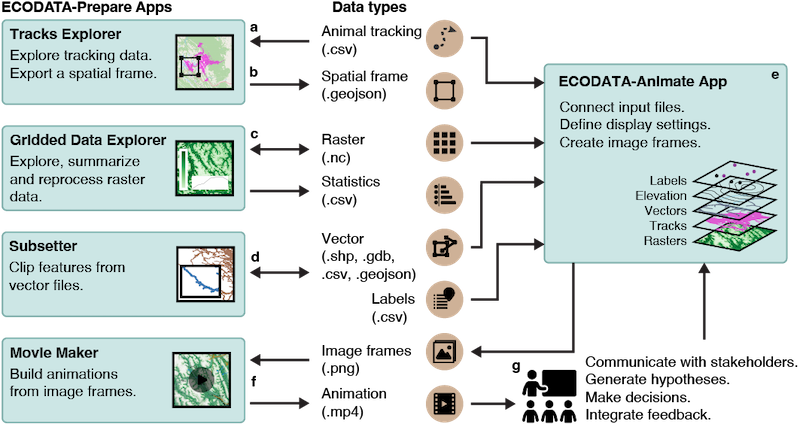
Below is an overview of the ECODATA apps, shown as blue boxes, in relation to the types of information geospatial information they process (see Missik et al., 2025). The apps can be used together or separately to manage large vector, raster and image files for wildlife management and movement ecology research.
Example ECODATA animation
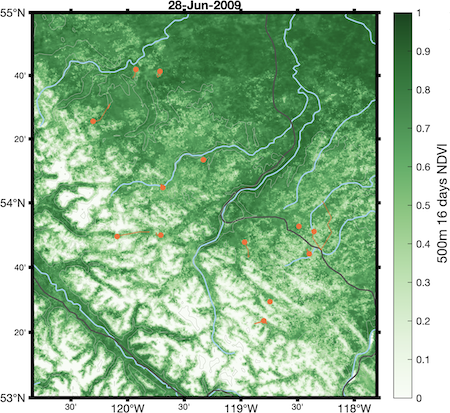
In the example below, ECODATA was used to create a custom animation of moose movements in southwestern Canada, using
- Tracking data from Movebank study Peters Hebblewhite Alberta-BC Moose
- Vegetation index (NDVI) from NASA product MYD13A1
- Elevation contours from the ETOPO1 1 Arc-Minute Global Relief Model
- Roads and rivers from Natural Earth
Download this package of source files to try out ECODATA-Animate, following the instructions below and in the user guides. Watch the video at https://youtu.be/A7reIKCmxZQ.
ECODATA custom animations
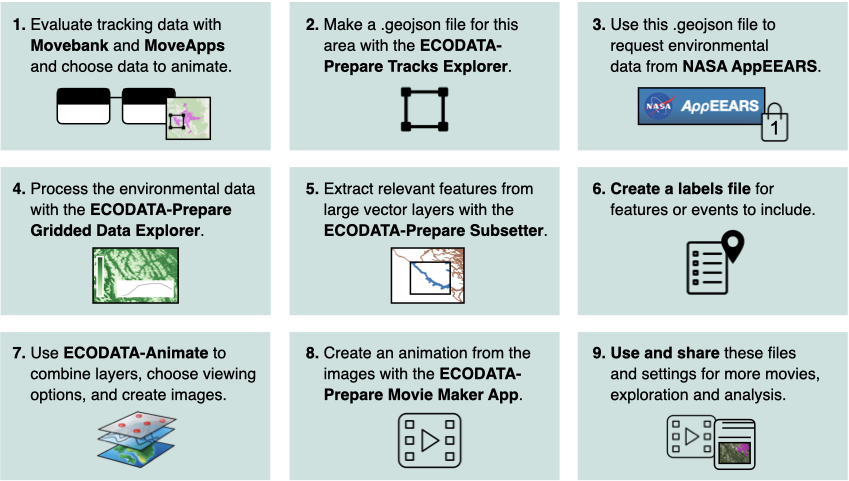
Here are the steps to creating an animation like the one above using ECODATA-Prepare and ECODATA-Animate. You can skip any steps of these steps you don't need. If you have not already, you will need to download and install ECODATA-Prepare and ECODATA-Animate, and register for a free account at Movebank and MoveApps if needed for steps 1 and 7.
Here are the same instructions with links:
- Evaluate tracking data with Movebank and MoveApps and choose data to animate. To explore how your data are spread over time and space, and narrow down an interesting scope for your animation, try out the Tracking data animations workflow in MoveApps.
- Make a .geojson file for your area of interest with the ECODATA-Prepare Tracks Explorer App.
- Use this .geojson file to request environmental data from NASA AppEEARS. This provides a changing environmental background for your animation. You can also order weather data from ECMWF or use your own raster data files.
- Process the environmental (raster) data as needed with the ECODATA-Prepare Gridded Data Explorer App. For example, coarsen the spatial resolution, or resample weekly data to daily.
- Extract relevant features from large vector datasets (e.g., shapefiles) with the ECODATA-Prepare Subsetter App. For example, crop features like roads, water bodies or protected areas to the area you will use in your animation to reduce image processing time.
- Create a labels file for features or events to include. For example, place names, or events to display at certain times during the animation.
- Use ECODATA-Animate combine layers, choose viewing options, and create images. These images compose the frames of your animation, and can be used for further exploration and analysis.
- Create an animation from the images with the ECODATA-Prepare Movie Maker App.
- Use and share these files and settings for more movies, exploration and analysis. Update your saved settings in ECODATA-Animate to easily create alternate versions of the analysis for different uses, open individual frames to explore data in more detail, and use processed raster data for other analysis.
ECODATA-Prepare
ECODATA-Prepare is a set of Python-based apps to access and process remote sensing and other environmental data products and prepare them for further use along with animal movement data. Output from ECODATA Prepare is designed to be used as input of environmental data layers for ECODATA-Animate, and can also be used as input to resource, habitat and step selection models.
Within ECODATA-Prepare,
-
The Tracks Explorer App includes tools to visualize animal tracking data as points and point densities with several static maps and define a spatial frame around the tracking data that is relevant for analysis. This spatial frame can be recorded as bounding box coordinates or saved as a .geojson file, which supports requests for environmental data from sources including the ECMWF weather reanalysis and NASA EARTHDATA AppEEARS, which offers a large range of global environmental data products. These products can be provided in or converted to NetCDF format for further steps described below.
-
The Gridded Data Explorer App allows you to interpolate and subset the temporal and spatial resolutions of environmental data in the form of a temporal stack (or single static map) NetCDF file. It can also read in several other data formats (which could be resaved as NetCDF). You can also read GIS polygons as shapefiles, and mask the environmental data outside or inside the polygons. It subsequently calculates data summaries by period and polygon.
-
The Subsetter App allows you to clip relevant features out of large shapefiles.
-
The Movie Maker App builds an animation out of a stack of static maps, which can be used as input to the ECODATA-Animate program.
-
The Annotation Engine App (under development) annotates animal observation records with environmental covariates provided as NetCDF files.
ECODATA-Animate
ECODATA-Animate is a MATLAB® program for creating animated maps of animal movements along with additional layers.
Inputs to ECODATA-Animate include
-
A file of movement track data in Movebank format (required). This can include additional columns such as environmental covariates annotated by Env-DATA or reference data attributes, and can include tracking data combined from multiple Movebank studies.
-
1-2 static and/or dynamic rasters (maps) in NETCDF-4 format (optional). One will be displayed as a colormap, the other with contour lines.
-
GIS shapefiles, lines or polygons (optional).
-
Lists of points to label on the map in .csv format (optional). Files must contain columns "longitude", "latitude" and "label" to indicate where each label's method and placement on the map, using coordinates in decimal degrees, WGS84 coordinate reference system. If present, the additional columns "startdate" and "enddate" can be used to restrict the display of the label to a range of dates.
-
In addition, ECODATA-Animate allows you to include elevation contours using the default mapping database (optional), which does not require input of DEM data.
The output of ECODATA-Animate is a set of high-resolution time-stepped .png images for inspecting conditions at individual timepoints, or to be used as a collection to create an animation with the ECODATA-Prepare Movie Maker or other movie-making tools.
Download and support
These applications are being developed by Justine Missik and Gil Bohrer at the Department of Civil, Environmental and Geodetic Engineering at the Ohio State University. Development is supported by MathWorks® and the NASA Earth Science Division, Ecological Forecasting Program. The applications are released in beta, therefore errors and bugs are expected. Your feedback on how the programs work with your data and operating system are greatly appreciated.
Try it out! See the links below to download the software, access user guides, and report feedback.
ECODATA-Prepare
Installation instructions: https://ecodata-apps.readthedocs.io/en/latest/installation.html
User guide: https://ecodata-apps.readthedocs.io
Feedback and requests: https://github.com/jemissik/ecodata/issues/new/choose
ECODATA-Animate
Installation instructions: https://ecodata-animate.readthedocs.io/en/latest/user_guide/index.html#installation
User guide: https://ecodata-animate.readthedocs.io
Feedback and requests: https://github.com/bohrer-lab/ecodata-matlab/issues/new/choose
![]()
![]()
![]()
MATLAB and Simulink are registered trademarks of The MathWorks, Inc. See mathworks.com/trademarks for a list of additional trademarks.
Citation
To cite the use of ECODATA, please refer to this paper:
Missik J, Davidson SC, Scyphers M, Hebblewhite M, Kelly A, Fieberg JR, Kays RW, Lohr A, Russell KL, Suitor M, Bohrer G. 2025. ECODATA—a toolbox to efficiently explore and communicate animal movements alongside environmental and anthropogenic context using geospatial big data. Methods Ecol Evol. 16(10):2318-2325. https://doi.org/10.1111/2041-210x.70141