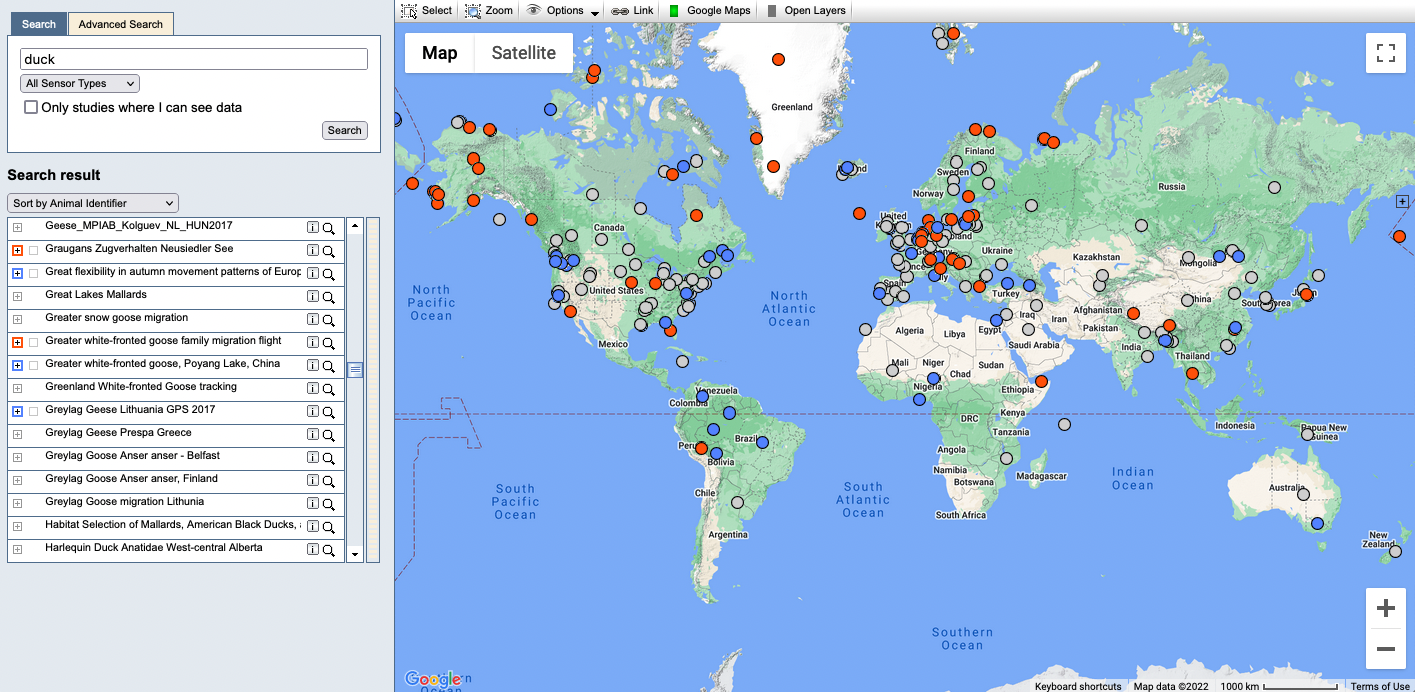
Tracking Data Map
The main place to view and search for data on Movebank is the Tracking Data Map (Data > Map). Here you see a map on the right and a search field and list of studies on the left. By default, the map displays markers showing a reference location for each study. These study markers, along with the corresponding icon to the left of each study name, are color-coded based on the access the data owner has provided to the public or to your account:
 Only the study name and a written summary are visible.
 One or more animal tracks can also be viewed.
 Data can be downlaoded.
You can explore further by selecting from the markers on the map or the list of studies, or using the map menu. To view animal tracks for a study (if available), select the checkbox to the left of the study name on the list, or click on the study marker and select Show movement data on map. You can then select individual locations to highlight a track on the map and in the list of studies.
-
Selected studies will show the number of deployments in brackets following the study name (each deployment contains one animal, and a study can contain multiple deployments for the same animal).
-
Select the + next to a study with visible tracks to view a list of deployments, showing the animal ID, number of recorded locations and taxon.
-
Check or uncheck the box to the left of each deployment to show or hide the track on the map, or click on the deployment description to highlight it on the map.
-
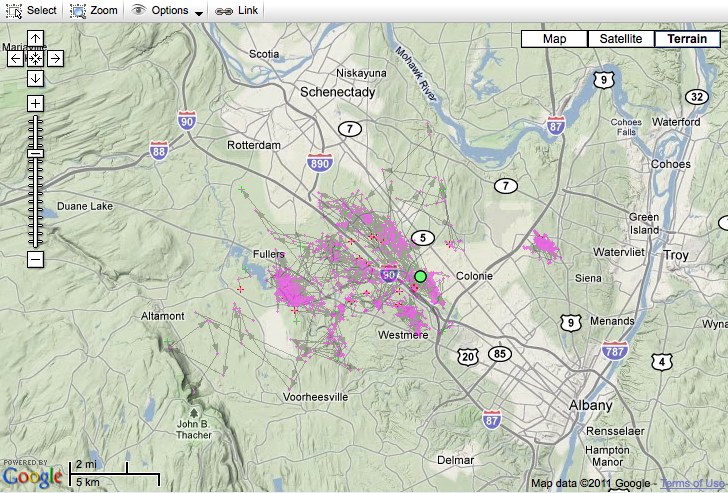
The starting point of a highlighted track is shown with a red cross, the ending point with a green cross. Crosses are not displayed if recent data are subject to an embargo.
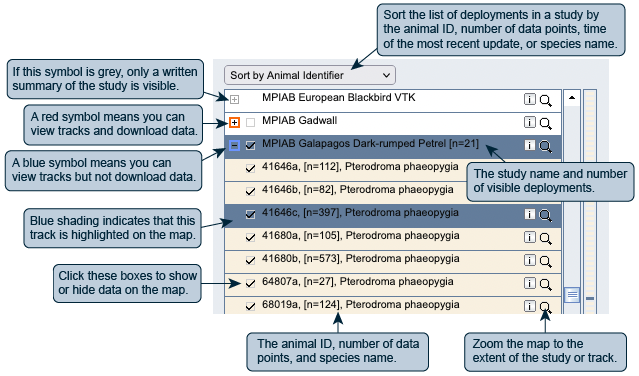
- To the right of a study or deployment on the list, select the zoom icon
 to zoom the map to the extent of the selection, or click on the info icon
 for additional information and options.

Possible options include the following:
-
Contact owner: Write a message to the contact person for the study an e-mail to the study contact, with questions about their work or to request permission to view or use data from the study.
-
Download search result: If you have permission to download the data, you may be asked to agree to the data owner's terms of use, and then can choose from download options.
-
Open in studies page or Show deployment in Studies page: These take you to the Studies page to view more information about the study or deployment.
Map menu
The map menu above the map includes viewing options, as well as tools for selecting tracks and creating sharable links:
-
Use the selector tool
 to select one or more tracks from those currently displayed on the map. Click on this icon and use your mouse to draw a rectangle around the area of interest. All tracks that intersect with the selected area will be highlighted on the map and in the results list.
 -
Use the zoom tool
 to zoom into an area on the map. Click on the icon and use your mouse to draw a frame around the area you want to see. The map will zoom in to display this area.
 -
Click on options to access additional viewing options.
-
Use the link tool
 to create a link you can save or share with others. Following the link will load the same map view and tracks that are visible at the time you click this icon.
 -
Select from Bing, Google Maps and Open Layers basemaps.
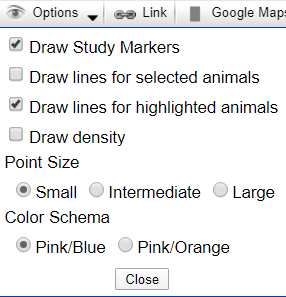
Map options
-
Draw study markers: Display or hide all study reference locations (selected by default).
-
Draw lines for selected animals: Connect all data points of the selected (visible) tracks with gray lines and arrows indicating the direction of movement (unselected by default).
- Draw lines for highlighted animals: Connect all data points of highlighted tracks with blue lines and arrows indicating the direction of movement (selected by default).
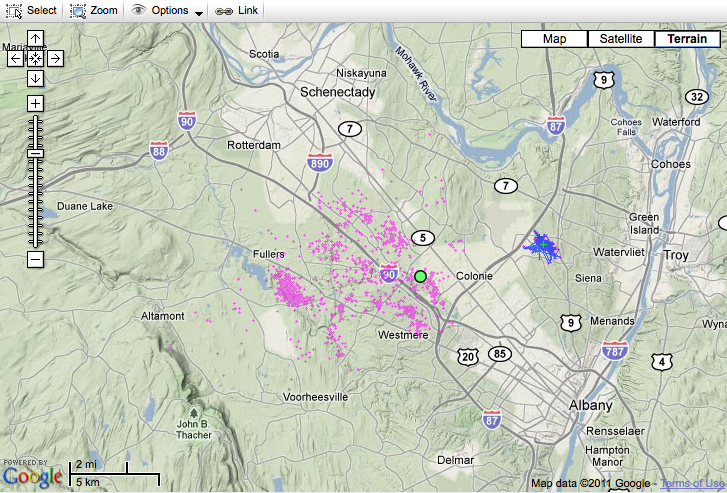
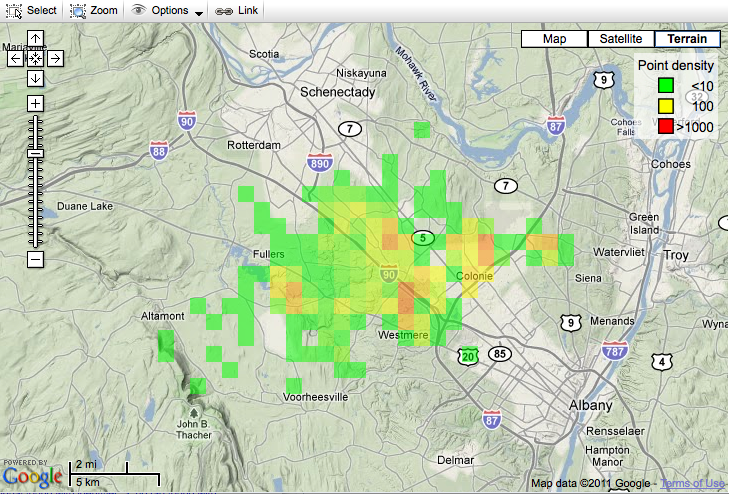
- Draw density: Calculate and display the density distribution of either data points ("point density") or deployments ("animal density"; each deployment contains one animal, and a study can contain multiple deployments for the same animal). The results reflect all data in the selected study or studies for which you have permission to view data, regardless of whether or not points or lines are displayed on the map.
-
Point size: Change the size of location points (small is selected by default).
-
Color schema: Change the line color of highlighted tracks (pink/blue is selected by default).
Basemaps
Movebank offers the option to use basemaps from Google Maps, OpenStreetMaps and Bing.
-
To view Google Maps, select
 . Icons in the upper left let you choose between their standard base map (Map, with or without terrain) and satellite imagery (Satellite, with or without labels).
 -
To view OpenStreetMaps and Bing, select
 . Then select
 to view a list of available maps, including OpenStreetMap, OpenCycleMap, and Bing road, aerial and hybrid maps.
When toggling between the Google Maps and Open Layers options, the map will reload to the default view of study markers and you will need to navigate back to selected studies and tracks. If using screenshots from the Tracking Data Map for presentations or publications, please be sure to cite Movebank and read and follow the terms of use for the basemap provider.
Search for data
In the main search field, you can enter keywords that might be contained in the Study Details. These can include the study name, taxon names, sensor type and the names of the project leader (PI or principal investigator) and contact person, common species names, sources of funding, and the content of study descriptions and related citations provided by the data owner. With appropriate access rights, searches will also include identifiers for tags, animals and deployments within studies.
Use the Sensor type dropdown list to limit the search based on the method used to estimate animal locations, and check the box next to Only studies where I can see data to limit the search to studies for which you have Permissions to view the animal tracks.
The Advanced Search option allows searches by taxon, for example the family Ramphastidae, the species Haliaeetus leucocephalus or the genus Panthera. Taxa are defined using the Integrated Taxonomic Information System (ITIS, itis.gov). Common names will not return results using the Advanced Search.
After clicking Search, the list of studies and map will update based on your selections, with study markers, study names and deployments now limited to those meeting your search criteria. All search results, and the possibility to view or download data from studies, depend on the access Permissions granted to the public, or to your account, which are defined by the data owner. Read above for more about how to view results, learn more about studies, access data and connect with the data owners.