The Env-DATA Track Annotation Service
The Env-DATA Track Annotation Service allows Movebank users to add environmental information to animal tracking data and related time-location records. This information includes hundreds of variables that are part of global environmental datasets provided by the European Centre for Medium-Range Weather Forecasts (ECMWF), the European Space Agency (ESA), the National Aeronautics and Space Administration (NASA), the US National Oceanic and Atmospheric Administration (NOAA), and others. You can browse information about available datasets here. The Env-DATA Track Annotation Service allows you to select what data to annotate, browse and select environmental variables, choose data interpolation methods, and submit an annotation request.
You must have permission to download data from a study in Movebank in order to access the service. Anyone who owns animal tracking data can add data to Movebank—all data owners maintain ownership of their data and have full control over who can view their study and view or download data. To get started, create a study and adding data or browse studies on Movebank.
To request annotation through Env-DATA,
-
Go to the Studies page and log in to Movebank.
-
Search or select the study from the list on the left to view the Study Details.
-
Select Env-DATA > Start annotation request from the Studies menu. You'll be asked to choose from three options:
- Annotate animal tracking data from this study (most common)
- Annotate generic time-location records (for advanced users)
- Annotate over a gridded area (for advanced users)
Annotate animal tracking data
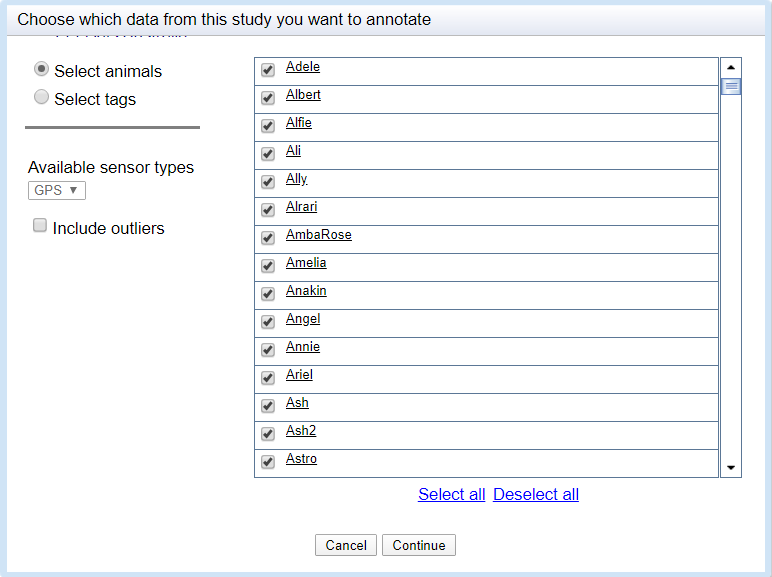
- Choose what animal tracking data you want to annotate. You can select from any of the Tags or Animals in the study, and can choose to include outliers and limit the annotation to one sensor type. When you are done select Continue.
-
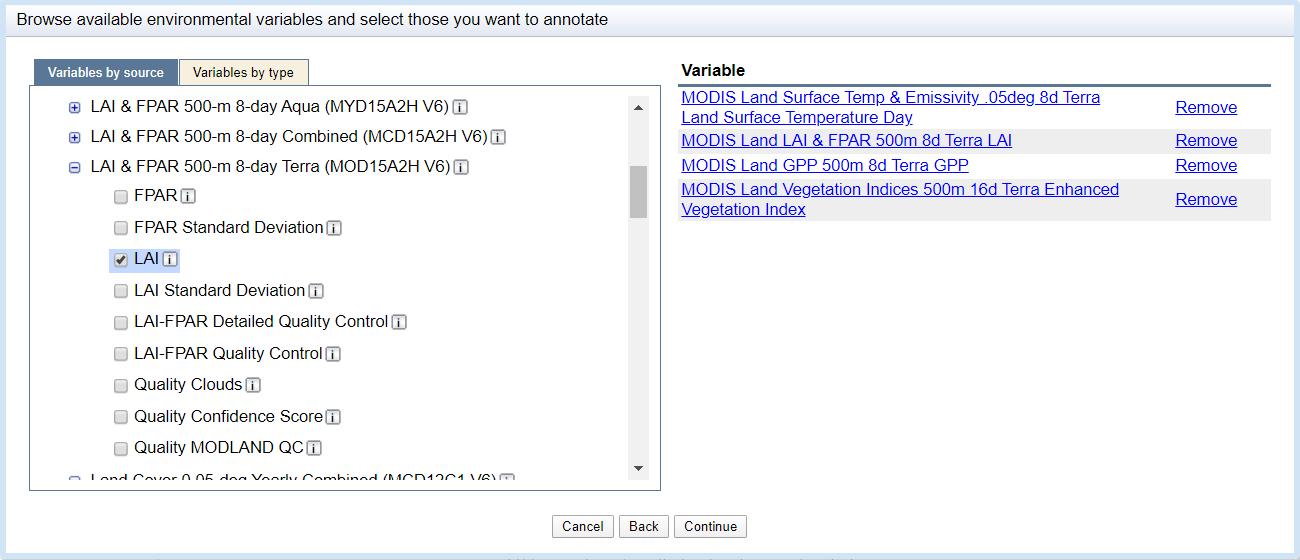
Next, browse and select the environmental variables you want to annotate. You can browse by source—such as MODIS Ocean or the ECMWF weather model—or by variable type—such as elevation or weather. To learn more about individual data sources or variables, click on
 to view more information and links. If you are requesting variables from multiple sources, we recommend splitting these into multiple smaller requests.
 -
To add a variable to your request, check the box next to it. Selected variables will be listed on the right. When you are done select Continue.
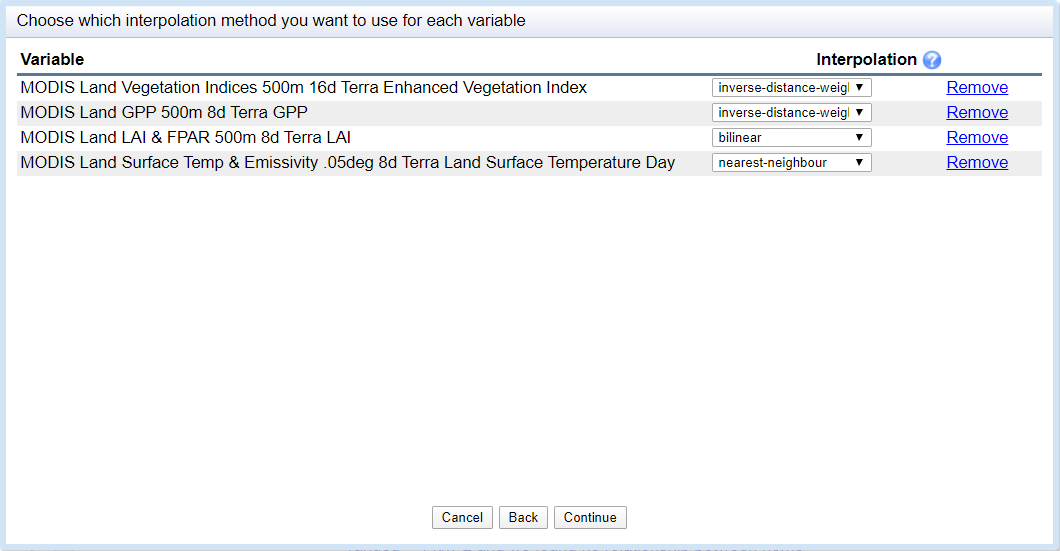
- Now, choose an interpolation method for each selected variable. This determines how Movebank will estimate values at each time-location record in the request. When you are done select Continue.
-
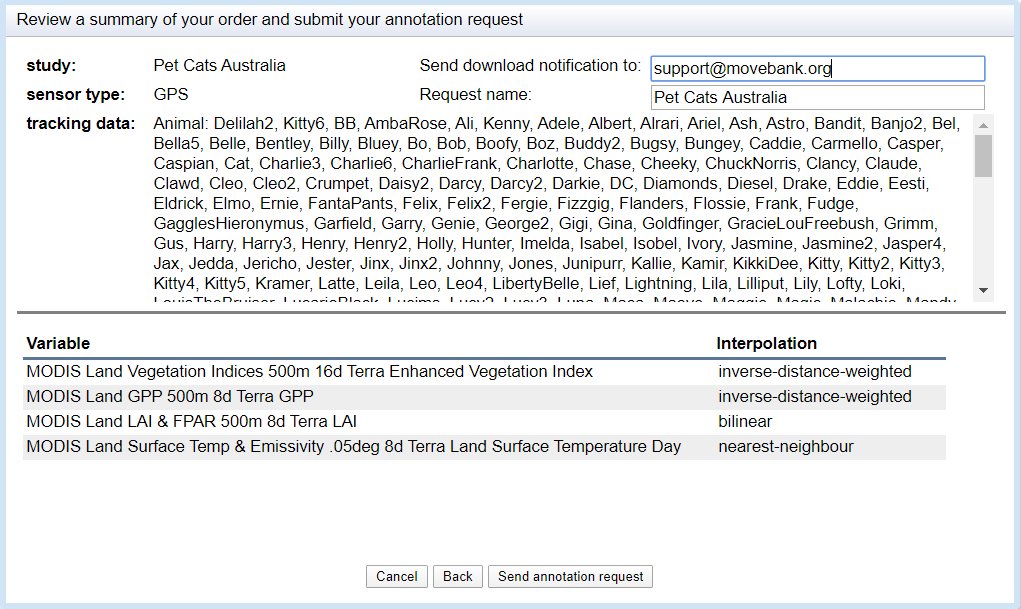
Finally, review a summary of your request. If you need to make changes, select Back to return to the previous steps.
-
When you have confirmed that your request is complete, enter your email address, provide a name for your request, and select Send annotation request. A link will be sent to this address when your annotated dataset is ready for download.
- A confirmation that your request has been submitted will appear. Select Close.
The time it takes to process your request will depend on the spatial and temporal resolution of your dataset and the requested environmental attributes, the number of other requests being processed and whether others have recently requested the same environmental data. You can check on the status of your requests by going to Env-DATA > Show my requests from the Studies menu from any study—the My requests table will list requests you have made from all studies. If you have not gotten your results within a week, please contact us for help.
Access annotated data
When your annotated data file is ready, it will be shown as available in the My requests table (under Env-DATA > Show my requests in the Studies menu). A download link will appear on the right side of the table. All downloads come as a .zip file containing the annotated data along with a readme file with additional details about the annotated variables—such as units and resolution of the source datasets—and about the data providers—including a link to the source and the provider's terms of use. Delivered requests will remain available for two weeks and then will be removed, so please store your downloaded results in a safe place.
Annotate generic time-location records
To analyze animal movements and space use, it is often helpful to get environmental information for times and locations related to but not the same as the animal location themselves, for example similated movement trajectories or randomly sampled locations within a home range. It may also be preferable in some cases to request annotation of a subset of tracking data from a larger Movebank study, or combination of data from multiple studies. This option allows advanced users to submit requests to annotate sets of generic data records provided in a .csv file.
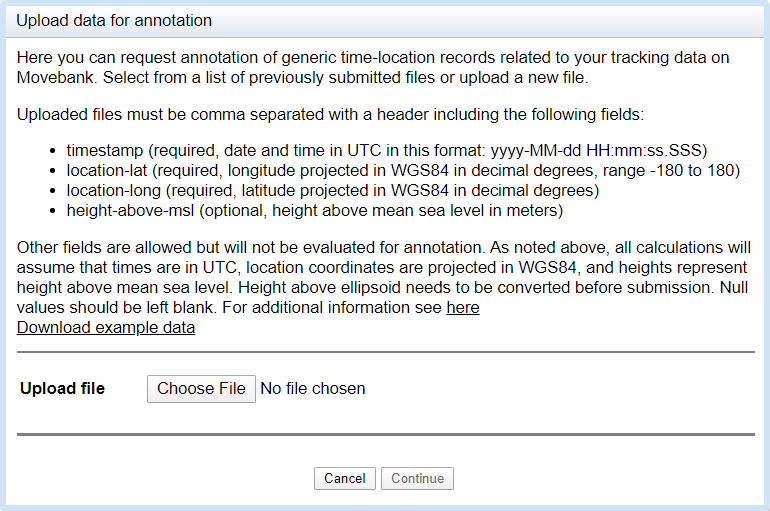
The file must follow the exact format described in the screenshot above. A simple file to annotate looks like this (download an example):
timestamp,location-long,location-lat,height-above-msl
2007-04-20 00:00:00.000,-90.12345,25.12345,
2007-04-20 03:00:00.000,-90.12345,25.12345,200
2007-04-20 06:00:00.000,-90.12345,25.12345,
The height-above-msl is only required if you will request vertical interpolation. Preparing the data may require you to reproject coordinates, convert times to UTC, or convert heights above ellipsoid or ground level to heights above mean sea level. Extra data columns can be included, but if there are many, you may want to include an index column and merge the results with your full dataset to reduce file volumes.
-
Click Browse to select the file to annotate. If you have submitted previous requests, use Select file to choose from files you have recently uploaded. If you receive an error message, review the instructions above and solutions to common formatting issues.
-
Select Continue to complete your request as described above.
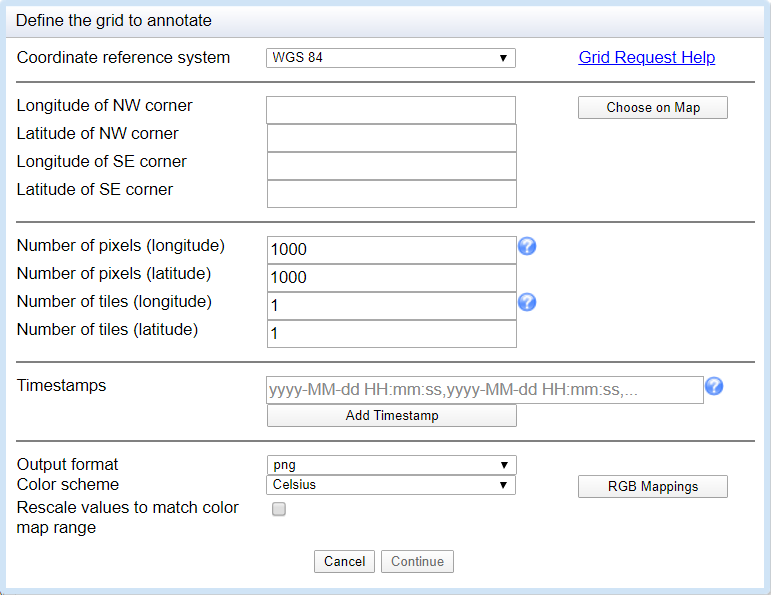
Annotate over a gridded area
This option provides raster output for analysis and visualization over a bounding box. Use this worksheet for help calculating the input described below. For NASA products, similar requests can also be made through the NASA Earthdata Search, as described in this tutorial from the National Snow and Ice Data Center.
-
First, provide the NW and SE corners of the bounding box of your grid. You can type in coordinates directly, or select Choose on Map to select the area from a map.
-
Number of pixels: Next, define the resolution of the output. Typically choose this to be in the same range as the resolution of the original product you will request (see instructions attached below). Data are always reprojected.
-
Number of tiles: This option is to split the output into multiple tiles if you have more than around 2000*2000 pixels. If not, leave the default (1) to get your results in a single raster per timestamp.
-
Timestamps: Provide one or more times for which to calculate results. You will receive a separate raster for each timestamp.
-
Output format: Choose from png (image file), png/kmz (georeferenced image for use with Google Earth) or geotiff (a raster containing calculated values).
-
Color scheme: If requesting png or png/kmz, choose a color scheme for creating the images. The names indicate types of variables that the scheme was designed to display.
-
RGB Mappings: Click here to download a zip file containing the R, G, B and annotated values that are used for each color scheme. These files can be used as input for ArcGIS colormaps (.clr) or QGIS styles (.qml).
-
Rescale values to match color map range: This option could be helpful if the results are difficult to see with the available color schemes. Note the RGB mapping values will no longer apply.
-
After filling out the form, you may want to take a screenshot to more easily repeat or adjust parameters for future requests. You will also see a summary of your chosen parameters before completing the request and in the readme file with your results.
-
Select Continue to complete your request as described above.
General tips for submitting requests
-
For fastest results, we recommend submitting separate requests for each data product. By doing so, you will receive notifications and results as each request is completed. In the case that one product has delays on the provider's side or returns an error, you will still receive all other results, and the time needed to resolve any errors will be reduced.
-
Request annotation of relevant QC variables when available. Links to related QC information and a list of relevant variables where available are displayed when browsing variables (click on the
for a product or variable). -
For requests to annotate high-resolution products, in particular ECMWF Global Atmospheric Reanalysis, plan your analysis and reduce the size of the request only to the data necessary. These requests can require the transfer of tens of thousands of data files and tens of gigabytes of data, and so removing unneeded records prior to annotation can reduce wait times and the chance of stalled or failed requests. You can create a subset of your tracking data and submit it for annotation as a file of generic time-location records.
-
If you request vertical interpolation of weather variables for records at or near the Earth's surface, you will likely recieve nodata values for these records, so you may want to also request similar surface-level variables.
Env-DATA Track Annotation Service