Quality control
Movebank supports data from a wide range of sources and allows users to import and manage data independently. Therefore, we cannot guarantee that all imported data are error-free. We encourage you to take steps to verify that your data, or other people's data to which you have access, are organized correctly.
Taking these steps soon after importing data will make it easier to fix any problems and help to prevent confusion later. If you are having trouble importing data, check for common formatting issues. For assistance please contact support@movebank.org. Also read our best practices for organizing studies for additional guidance on creating archive-quality studies.
Note that you must be a Data Manager for a study to add or change data. Users who are not Data Managers should see suggestions for working with other people’s data.
General QC steps
-
Check the locations. View your tracks on the Tracking Data Map and make sure each track is displayed correctly. Use the option to draw lines for selected animals to easily identify some kinds of outliers and mistakes in mapping timestamps.
- Steps are often needed to exclude events that should not be considered part of an animals' track because
- They were not collected when the tag was on the animal (undeployed locations). Solution: Add deployments or fix incorrect deployments.
- They represent outliers that should be ignored. Solution: Flag outliers manually or using a filter.
See below for an example of how to assess studies containing a mix of location quality issues.
- If the number of tracks is less than expected, it could be that deployment information is missing. To view undeployed locations, select View > Show in map (include undeployed) from the Studies page. Solution: Fix incorrect deployments.
- If locations are imported using the wrong coordinate reference system, the tracks will be slightly shifted from their actual locations. Solution: Fix incorrectly mapped values.
- If the lines between locations are clearly wrong, check that the timestamps and tag IDs were imported correctly. View timestamps and locations in the Event Editor, or select Sort by last update on the map to see the last date for each deployment. Incorrectly mapped timestamps can result in timestamps in the future. Solution: Fix incorrectly mapped values.
-
Check attribute values. Download all or part of the imported data and compare attribute values for a few events to those in your original data file. In particular, check that the timestamps are correct and that any conversions or controlled-list mappings worked as expected. (If you select the wrong time zone when mapping your timestamp, there is no way for Movebank to know this is incorrect! Timestamps stored in Movebank use the format yyyy-MM-dd HH:mm:ss.SSS and are always in UTC.)
Use the Attribute Dictionary to confirm your values match Movebank’s definitions, especially for terms that have defined units. Solution: If needed, fix incorrectly mapped values. If additional information is needed to understand values for some data terms (such as values in generic attributes like “tag tech. spec.”), include this information in the reference data, Study Details or a file attachment.
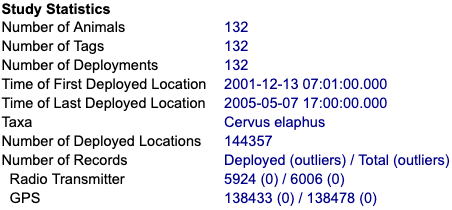
- Check study statistics. Are these what you expect? In a completed study, the statistics shown in the Study Details should look something like this:
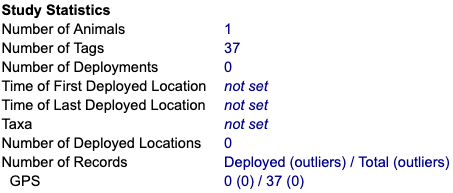
Incomplete or incorrect statistics might indicate you haven't yet provided the information needed to properly assign data to animals. In this case you might see values of 0 or not set, like this:
If the Time of First and Last Deployed Location or Number of Deployed Locations are present but not what you expect, check that the timestamps were imported correctly. Incorrectly mapped timestamps can result in timestamps in the future, or reduce the total number of locations, depending on how duplicates were treated during import. Solution: If needed, Add or fix deployments or reimport incorrectly mapped values.
-
Check for duplicates. In some cases, the presence of duplicates in the imported data can indicate mistakes in mapping IDs and timestamps or problems in the original data file. Solution: Use the duplicate filter to search for and flag duplicate records, and reimport incorrectly mapped values if needed.
-
Check out the data in another program. Check out your imported data in other software programs that you commonly use, to make sure it behaves as expected. You can do this by downloading the data or accessing through the REST API.
See below for detailed instructions to add deployments and missing species, fix incorrect deployments, flag outliers, and fix incorrectly mapped values.
Add deployments and reference data
If the statistics in your Study Details say you have 0 deployments, this means any data you have imported are not associated with animals. By associating tags with animals using deployments, you define which data represent actual animal movements and behavior. Read more.
Deployments are part of a study's reference data, which allow you to provide information about animals, tags and deployments in the study. Read tips or download a template with examples for help deciding what to include. By using deploy on timestamp and deploy off timestamp, you can define the start and end of deployment periods, including studies where tags and animals are part of multiple deployments.
We recommend downloading the reference data from your study before making changes, to review what is there and as a backup in the case of unexpected results. From the Studies page, go to Download > Download Reference Data.
There are four ways to add and update deployments and other reference data in your study:
- You can add reference data for many tags or animals by uploading a reference data file.
- If you have only a few animals or tags, you may find it easier to use the Deployment Manager.
- You can also edit reference data directly from the Studies Page.
- If you have not yet added data to your study, you can map both tag and animal IDs while importing custom tabular data files, and Movebank will attempt to automatically define deployments following import.
Add missing species

If the statistics in your Study Details say the taxa is not set, this means that you have not created animals in the study or that the animals have no taxon assigned.
If all animals in your study are the same species/taxon, you can quickly assign the taxon for all of them at once:
- From the Studies page, select Manage > Deployment Manager.
- Select Batch Edit > Animals.
- Check the box next to Taxon.
- Enter a taxon that complies with the ITIS taxonomy.
- Select Update ALL Selected Animals.
If your study contains multiple species, you can select or deselect animals on the list to assign different taxa.
If your study does not yet contain animals, or to import a file with taxon assignments, see fix incorrect deployments below. If your taxon is not accepted, see "Why is my taxon invalid?" in the FAQ. For deployments relevant to the study that are not on animals, the values "test" and "calibration" may be used.
Fix incorrect deployments
Sometimes while importing or organizing data in your study, deployments are mistakenly assigned, or unwanted IDs are created. Use these steps to check your current deployment information and update if needed.
- From the Studies page, go to Download > Download Reference Data. This will give you a table of all the reference data (deployment, animal and tag information) that are currently in the study. This table contains one row for each deployment, and one row for each animal or tag ID without any associated deployment. In this table it is usually easy to see if unwanted tag or animal IDs have been added, or if tag or animal IDs are not linked together by deployments.
Based on what you find here, you can update the reference data as needed. If everything looks good, you're done!
To remove and reimport all existing reference data in the study, keep the downloaded reference data file as a backup, and follow these instructions:
-
From the Studies page, select Manage > Deployment Manager.
-
Use Batch Edit to delete all animal IDs. This will remove all the animal and deployment reference data. If you delete tag IDs with associated data, those data will also be deleted. You will receive a warning if data will be deleted.
-
Edit your downloaded reference data file to update the deployment assignments. Each deployment should have a row containing tag ID, animal ID and animal taxon. If pre- or post-deployment events are included in the event data, deploy-on date and deploy-off date are required to exclude them. You can also add more reference data information—see our archiving best practices for a minimum suggested set of reference data attributes.
-
Now reimport the updated reference data file.
-
If you need to rename tag IDs that have associated data, you can use the reorganize tags option of the Deployment Manager after importing the reference data file. Alternatively, you can rename tags individually from the Deployment Manager or Studies page, or delete the tags and data and then reimport the data with corrected tag IDs.
Flag outliers
Outliers can include incorrect times and location coordinates caused by equipment or data processing problems, or records for which the accuracy is too low to include in an analysis. In the latter case, defining what points are outliers can be subjective, depending on how the data will be analyzed; for example, greater error might be acceptable when evaluating long-distance migration than when analyzing local foraging behaviour.
In Movebank, events flagged as outliers will contain the value visible = FALSE. There are several ways to identify and flag outliers in a study:
- Select and flag individual records in the Event Editor using manually marked outlier.
- Use data filters to assign records as outliers using algorithm marked outlier.
- If you are using data feeds, some data providers will indicate outliers as import marked outlier = TRUE.
- If you have data files that include an outlier flag, you can map these values during import.
See below for an example of how to complete a comprehensive QC review of data in your study.
Fix incorrectly mapped values
If you find that attributes were mapped incorrectly during import, you will typically need to delete and reimport the affected data files. The most common problems are timestamp formats and unit conversions for attributes with units.
- If needed, view details of individual tags or files within the Studies Page and Event Editor to assess which portions of the data are affected.
- Delete the affected file/s.
- Reimport the file, being sure to correct the mapping problem.
- It is sometimes easier to delete and recreate the study.
Quality control of studies with many outliers
Data imported to Movebank will often contain locations that should be excluded from analysis and from tracks viewed on the Tracking Data Map. Movebank is designed to help users identify and manage these locations (read more). The following is a sample QC-checking procedure for such a dataset after the event and reference data have been imported. This example combines many of the general qc steps described above.
First, review what you have in your study.
Start with a review of what you have imported to the study.
-
From the Studies page, go to Download > Download Reference Data.
-
Open the downloaded file so that you can refer to it during the next steps. Add a column to the table to note which tracks to inspect further.
-
Now select View > Show in Map to view the data on the Tracking Data Map. On the left you will see a list of Animal IDs, with one row per deployment.
-
Click Options and check the box next to Draw lines for selected animals.
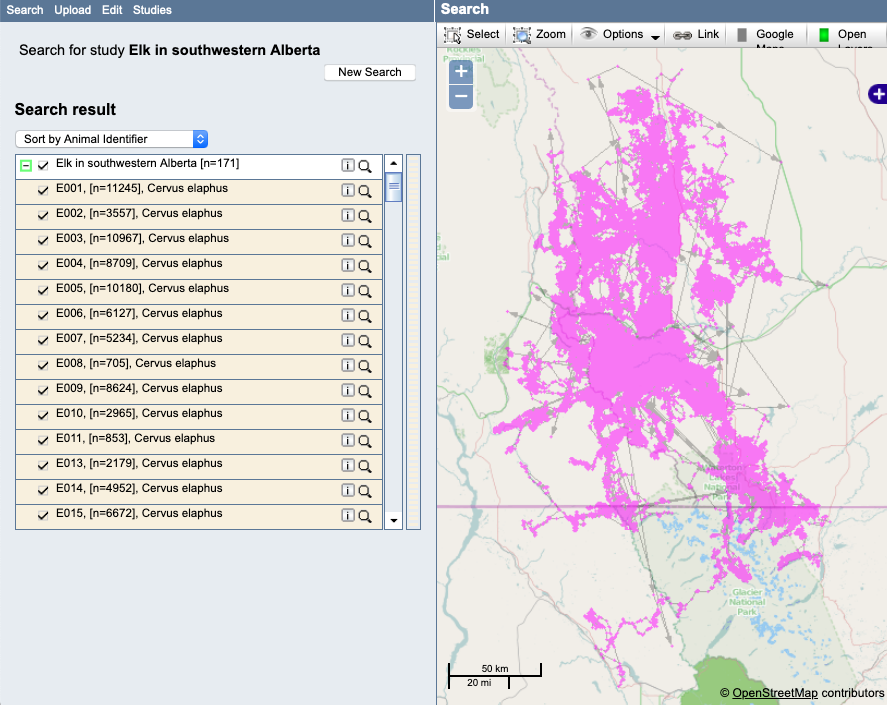
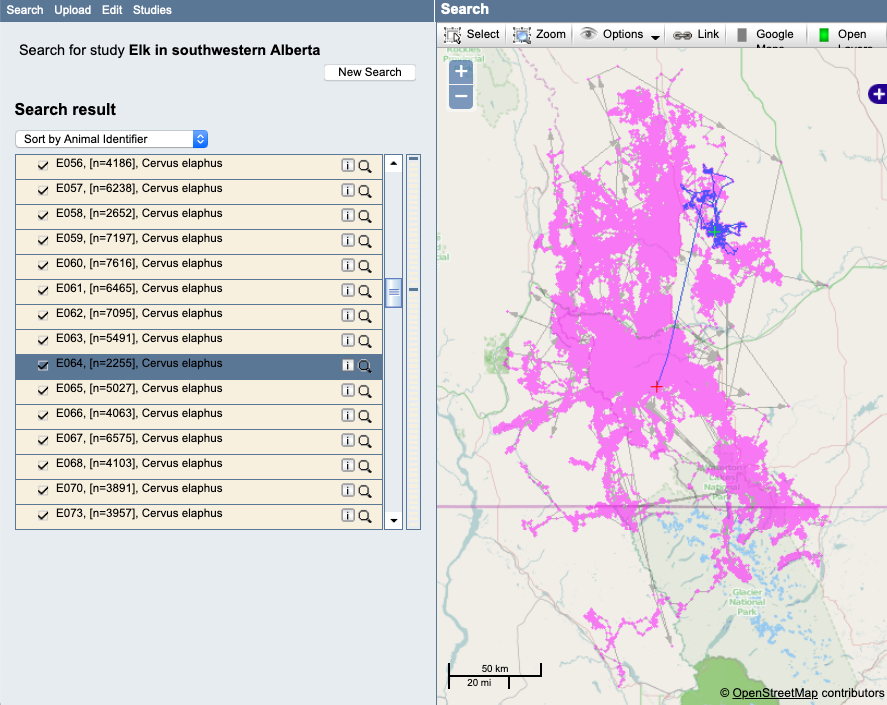
Example: Here is a view of the example study after importing and prior to QC checking:
- Select the deployments/animals one at a time from the list to highlight each track on the map. Review each track for possible outliers or undeployed locations. Here are some of the things you might find to look at more closely.
Example: Here it looks like the start of the track (the red cross) might be from prior to the actual deployment:
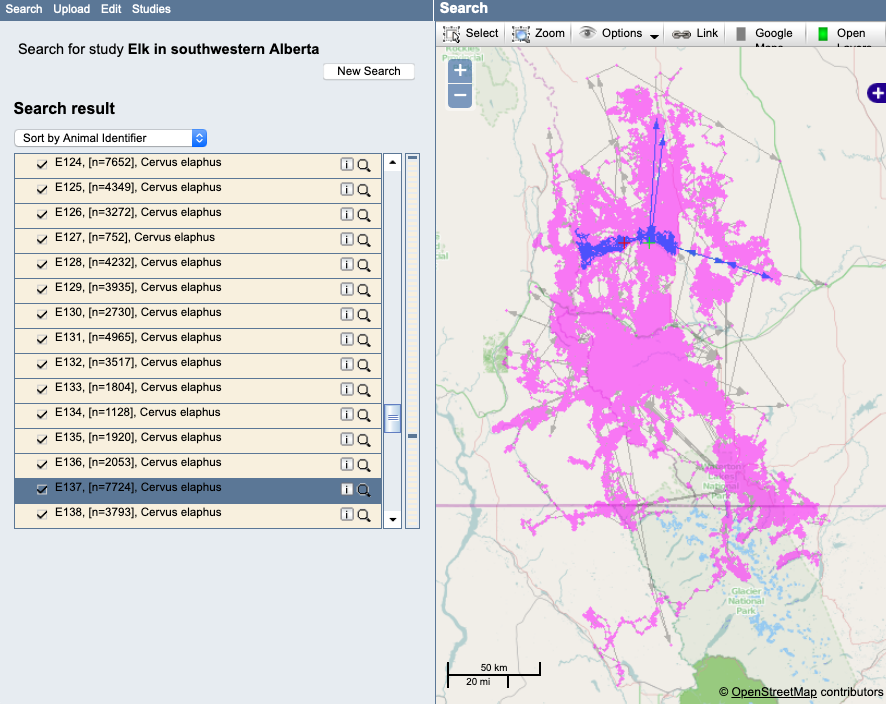
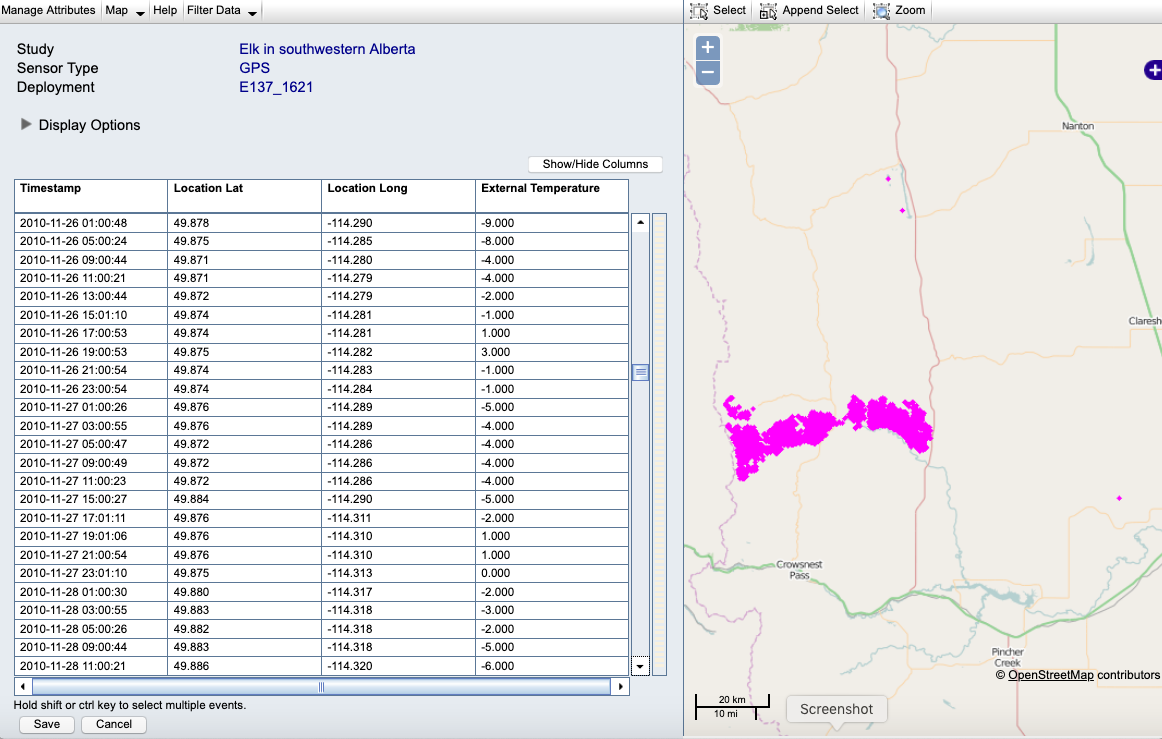
Example: A track with outliers. Notice that these outliers are only apparent if the single track is highlighted, since they occur in the midst of other valid occurrences:
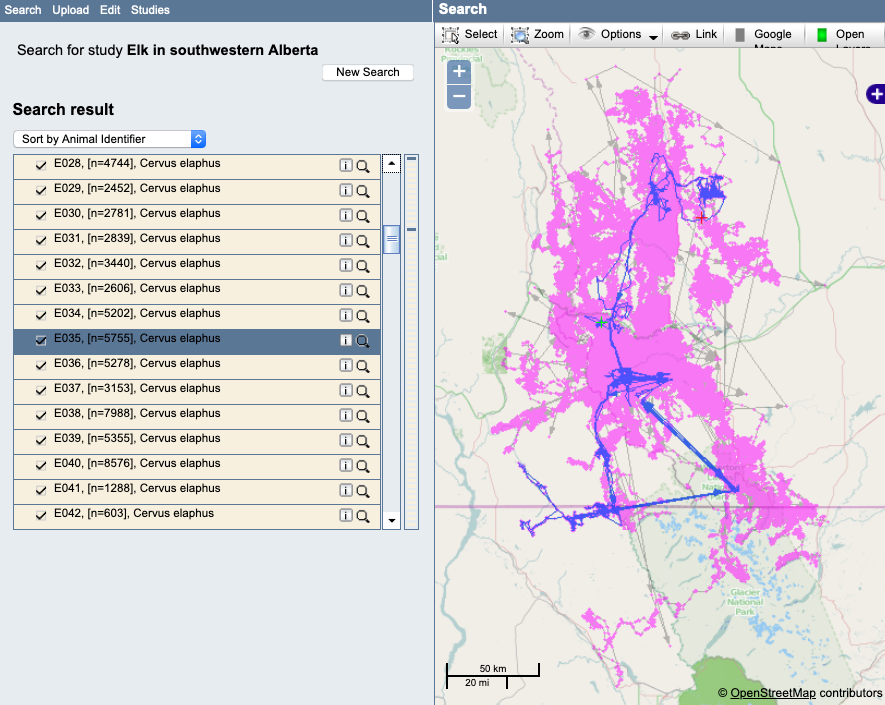
Example: A track with a questionable movement pattern that should be looked at more closely:
Next, use the Event Editor to review and filter the data.
Now use the Event Editor to have a closer look at any tracks that you flagged in your review.
- If the study contains < 500,000 location events, you can open the entire study in the Event Editor. If the study contains > 500,000 location events, or if it will be easier to check the tracks individually, you can open the Event Editor for individual tags, animals or deployments.
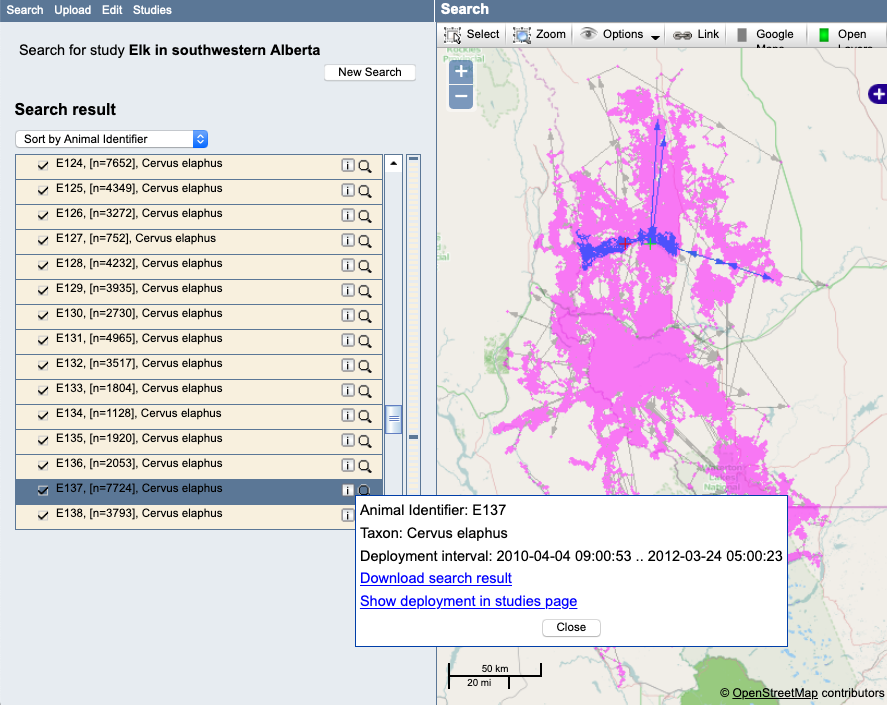
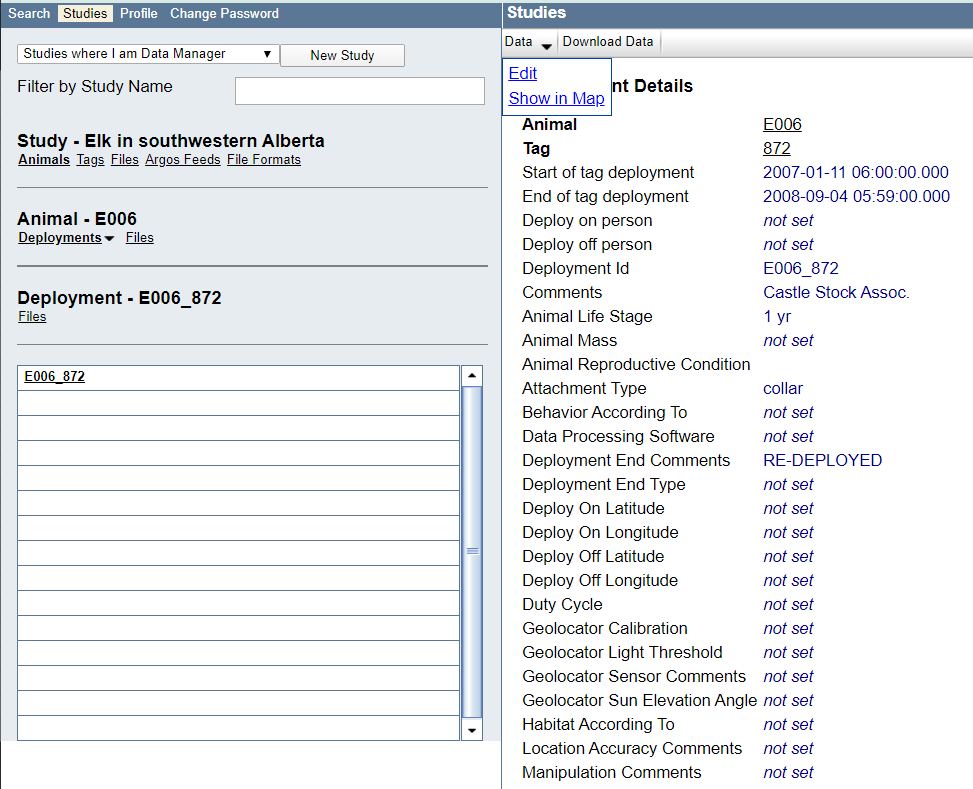
Example: From the map, select the "i" next to a track (deployment) and choose "Show deployment in Studies page":
Example: View of the deployment on the Studies page, and choose Manage > Event Editor to view the data:
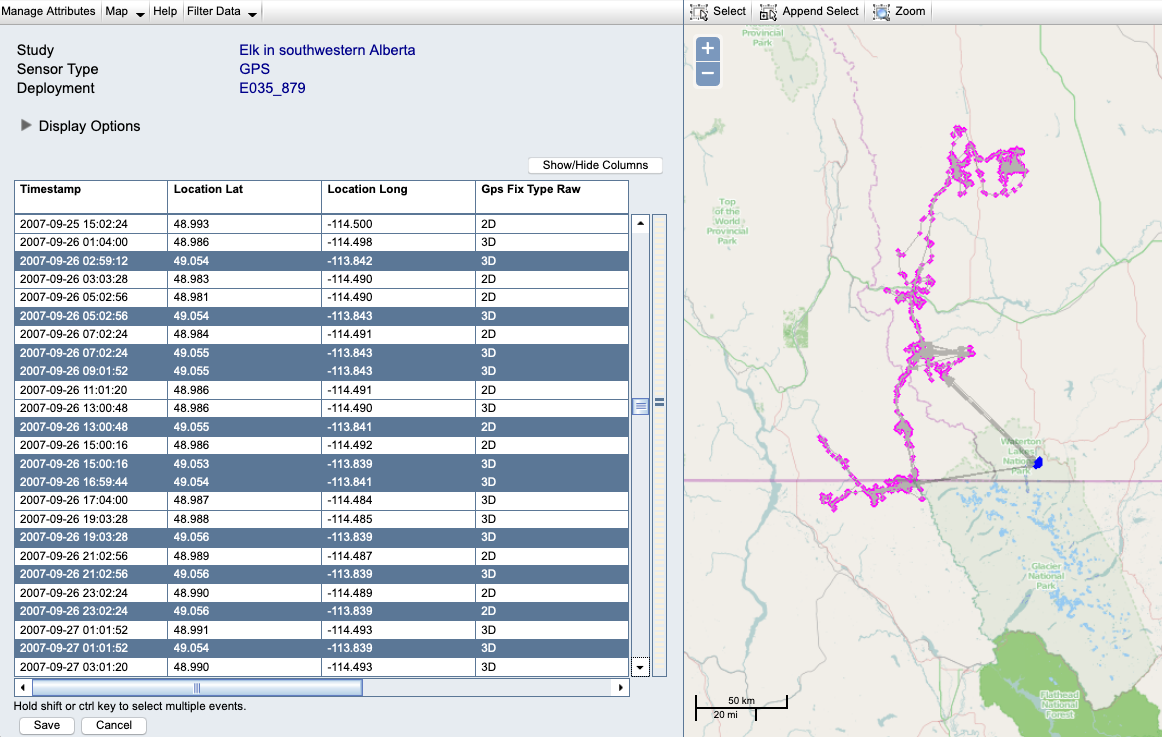
If there are only a few visually obvious outliers, it might be easiest to manually flag them in the Event Editor.
Example: Here is our deployed track with outliers in the Event Editor before changes:
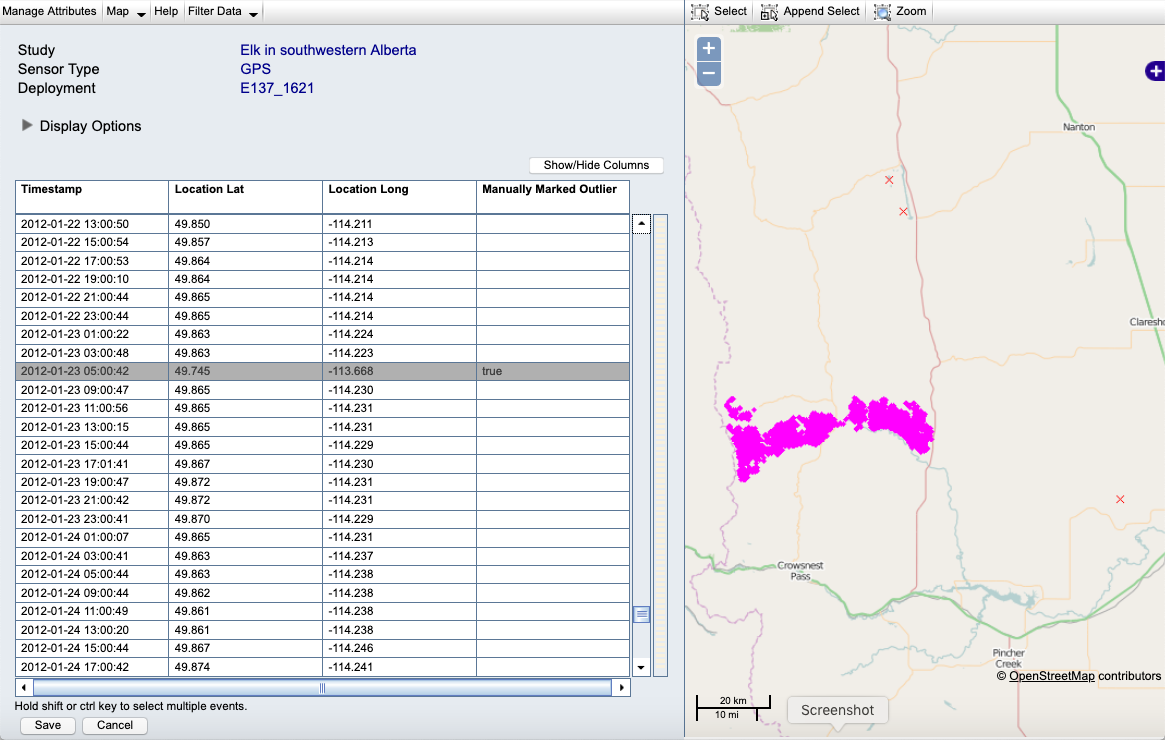
Example: Here is the track after flagging the outliers (red Xs):
If there are many outliers, or if it is difficult to notice them visually, it might be best to decide on a set of filter parameters and apply this to the entire study. The result of filtering will look the same as the manually flagged outliers above, except that the outliers will be flagged using the attribute algorithm marked outlier rather than manually marked outlier.
Note: What exactly is an outlier? Your desired filter parameters might depend on the current use of the study. For example, to share tracks with the public or to analyse local movements you might want to filter out even small outliers, at the expense of also filtering some good-quality locations, whereas for an analysis of long-distance movements, you may want to retain more locations even if some small outliers are present. Similarly, retaining duplicate tag-and-timestamp records might be fine for some purposes but cause problems for others. Because Movebank flags but does not delete outliers, you will not lose data and can update these settings anytime.
In some cases you will need to do something other than flag outliers.
If the outliers occur at the beginning or end of the track, evaluate whether the deploy-on or deploy-off dates need to be updated, and make the change in your downloaded reference data table or in the Deployment Manager.
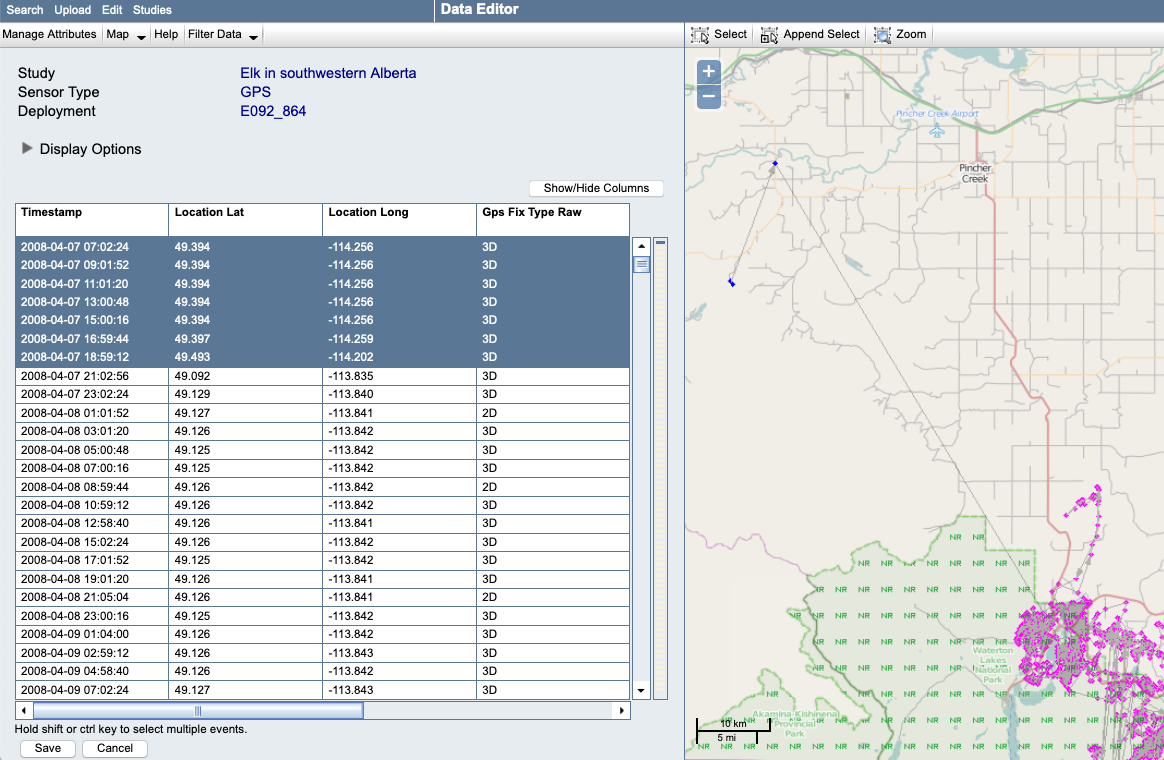
Example: For this track, here we can see that the locations are probably accurate (not outliers) but were collected before the tag was attached to the animal. We can fix this by changing the deploy-on date to 2008-04-07 21:02:56:
You might also identify a pattern that needs to be looked at more closely, possibly by returning to the original database or file from which the data were obtained.
Example: The pattern here could be caused by incorrect timestamps or tag IDs in the original data. This could be resolved by flagging the entire set of highlighted locations as outliers, or by deleting the file containing these records and importing a corrected file:
Update reference data.
- During the review process you might find that changes to deploy-on date and deploy-off date are needed, or notice changes or additions to make to other reference data. You make the change in your downloaded reference data table and import this file, or make individual changes in the study following the instructions above.
Review your changes.
- View on map again to review your changes and confirm that your QC checks are complete. Repeat steps as needed if you find additional changes to make. Keep in mind that updates to the calculated statistics and maps can take some time (typically less than 30 minutes) to update, so outliers might continue to display on the map for a while after you have successfully flagged them.
Working with other people’s data
If you are working with studies for which you are not a Data Manager, you can still follow many of the steps above to assess data prior to use. Here are two common situations related to QC checking:
-
You find outliers or questionable locations. In this case, you could use Movebank to identify things to check, and edit your downloaded data as needed with other tools. If possible, contact the data owner with questions in case they can clarify or correct any errors using the steps described above.
-
You want to ignore filtering done within Movebank. In some cases you might want to apply your own filtering procedures outside of Movebank. For example, you might need to apply consistent procedures across many datasets, or want to use less restrictive settings to retain more data. To access the full dataset includig outliers, download the data from the Studies page and check the box next to include points marked as outliers. Events with visible = false will indicate records that are considered outliers.
Our analysis platform, MoveApps, offers a variety of filtering apps to subset and filter data in the context of specific analysis workflows. If you'll be working with many people on a project, see our tips on running collaborations using Movebank.
Guide data owners to help improve their studies.
Below are draft email templates you can use when communicating with data owners about common quality issues.
Studies with missing species names: "I noticed that in your study on Movebank, [study name], no species name has been assigned to the animals. Could you please add this information? This will streamline the data processing for our project. For instructions, read here or watch this tutorial. If you'd like me to do this for you, you can add [your account name] as a Data Manager for your study and let me know. You can also contact support@movebank.org for assistance. Thank you for your help with this!"
Studies with missing deployments: "I noticed that in your study on Movebank, [study name], your data have not yet been linked to animals. Could you please update this information so we can interpret the data correctly? This will streamline the data processing for our project. You can do this by creating deployments, which Movebank will use to assign tag data to animals. Read here for instructions. Let me know or contact support@movebank.org if you need assistance. Thank you for your help with this!"
Studies with unmarked outliers: "I noticed that in your study on Movebank, [study name], there are some large outliers. Could you please mark these as outliers? This will help the data processing for our project. For instructions, read here. If you'd like me to do this for you, you can add [your account name] as a Data Manager for your study and let me know. You can also contact support@movebank.org for assistance. Thank you for your help with this!"
Studies with insufficient reference data: We recommend preparing a template based on these examples that includes any information about the animals, tags and deployments that are important to know for your project. See here for a list of minimum suggested attributes. Often information is available in related papers but has not been added to the study—in this case you can even draft updates for them. "Please see attached a template of reference data about your study that we'll need for our project. Could you please update this information in your study on Movebank, [study name]? This will help the data processing for our project. Read here for instructions. Let me know or contact support@movebank.org if you need assistance. Thank you for your help with this!"
Study contact with obsolete email: If you send a message to the Contact Person of a study and receive a response that the address is no longer in use, you can contact support@movebank.org for assistance finding a current address. If you are able to find an alternate contact, you can advise them how to update this information in Movebank. "I received a message the email address associated with your study on Movebank, [study name], has changed. You may want to update this address so others can contact you and to avoid losing access to your data. See instructions here or contact support@movebank.org."
Quality control of uploaded data