Event Editor
The Event Editor allows you to add and remove data attributes from your study, manually edit your data, and apply data filters. This is also where Data Managers can explore data in both tabular and map format.
The Event Editor currently supports entities containing up to 500,000 events. If your study contains more than 500,000 events, you can work with a subset within a specific temporal range or with individual animals, tags, deployments or files within this limit. For help filtering or flagging outliers for larger entities, contact support@movebank.org.
To open the Event Editor,
- Go to the Studies page and log in to Movebank.
- Select your study from the list on the left to view the Study Details.
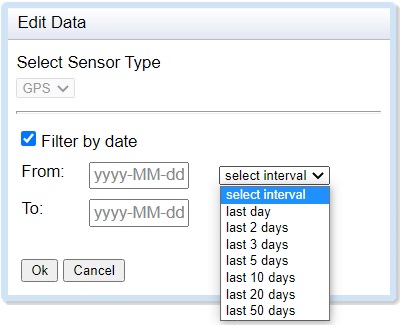
- To access the entire study, select Manage > Event Editor from the Studies menu, if needed select the desired Sensor Type from the dropdown menu, select Ok, then wait while the Event Editor opens.
- To access recent data or data from a specific date range (recommended for studies with >500k locations), select Manage > Event Editor from the Studies menu, if needed select the desired Sensor Type from the dropdown menu, check the box for Filter by date then set From/To dates to define your range of interest or select an interval from the dropdown menu. Select Ok, then wait while the Event Editor opens.
- To access data for a single animal, tag, deployment or file, first find the entity by navigating the menu just below the study name on the left. When the correct entity details are shown on the right, select Manage > Event Editor from the Studies menu.
The Event Editor will open and looks like this:
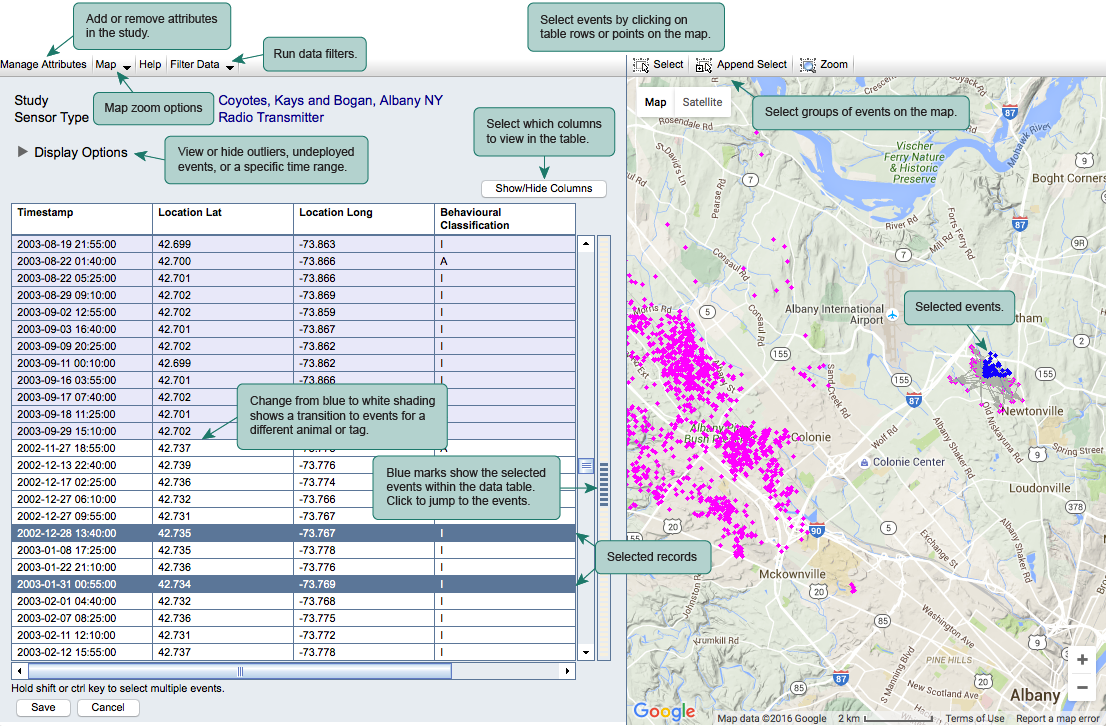
After the Event Editor opens, you can
-
Select events from either the table (rows) or the map (points); selected events will be highlighted in both places. Use the Shift and Control keys to select multiple rows, or the selector tool
 and append select tool
 to select groups of points.
 -
Use Display options and Show/hide columns to adjust which rows, locations and columns are visible.
-
Select Show/Hide Columns to change which attributes of the tabular data to view.
-
Use Manage Attributes to add or remove attributes in your data. Be sure not to remove attributes that you only intend to hide on the screen!
-
Run data filters to automatically flag outliers based on chosen criteria. Read instructions here.
-
Click twice on a cell to edit the value of that cell.
To edit a value in multiple selected rows,
-
Click on one of these rows in the cell of the column you want to edit.
-
Select batch edit.
-
Select or type in the desired value.
-
Select Save to apply changes.
See below how to
Manually mark outliers
You can use the Event Editor to manually mark events as outliers. (Read more about outliers.) Events marked as outliers will no longer be visible from the Tracking Data Map, but will remain part of your study and can be optionally included in downloaded data.
To mark outliers,
- Log in to Movebank and navigate to the Studies page.
- Search or select your study from the list on the left to view the Study Details.
- Select Manage > Event Editor from the Studies menu, and wait while the Event Editor opens.
- Select Manage Attributes from the upper left. A list of Available Attributes (left) and existing Data Point Attributes (right) will appear.
- Select Manually Marked Outlier from the Available Attributes.
- Click on the -> arrow key in the middle of the window to add the attribute Manually Marked Outlier to your dataset.
- Select Apply.
- Next, select Show/Hide Columns. A list of all the attributes currently in the event data will appear; those that are selected are displayed in the data table.
- Select and unselect attributes so that only Timestamp, Location Lat, Location Long, and Manually Marked Outlier are selected. This way you will be able to easily see these attributes in the tabular view.
- Select Apply.
- Next, select one or more outlying events from either the map or table (hold down Shift to select multiple consecutive locations in the table).
- Click the cell in the Manually Marked Outlier column of the table in the selected row (if you have selected multiple rows, you can click on the cell in any of the selected rows).
- If only one row is selected, select True.
- If multiple rows are selected, check the box next to batch edit and then select True.
- Repeat steps as necessary to mark additional outliers.
- Select Save.
The new value True should now appear in the table for these events, and the rows will be shaded in gray, indicating they are no longer visible from the Tracking Data Map by default. On the map, the outlying points will now appear as red Xs. Note that values in Manually Marked Outlier will override values in Algorithm Marked Outlier for determining what events are visible on the map.
Manually select alternate Argos locations
Argos Doppler-based location data include two possible locations for each timestamp—a primary location (Solution 1) and a "mirror" location (Solution 2) (see the Argos manual for details). When you import raw Argos Doppler Shift data to Movebank, by default Solution 1 is assumed to be the more accurate location estimate, therefore storing these coordinates as location lat and location long and displaying them on the map. However, in some cases Solution 2 is the more accurate of the two locations. If you run one of the Argos filters, Movebank will run an algorithm (see Douglas et al., 2012) to identify these cases and update location lat and location long to store the coordinates from Solution 2.
It is possible to manually select which Argos location estimate to store as the location in Movebank. To do this,
- Log in to Movebank and navigate to the Studies page.
- Search or select your study from the list on the left to view the Study Details.
- Select Manage > Event Editor from the Studies menu, and wait while the Event Editor opens.
- Select Show/Hide Columns. A list of all the attributes currently in the event data will appear—those that are selected are displayed in the data table.
- Choose attributes to show only the attributes you need to identify the events you want to change. (If you have filtered your data in Movebank and want to see the selections Movebank has made between primary and alternate Argos locations, be sure to select Argos Valid Location Algorithm). This way you will be able to easily see these attributes in the tabular view.
- Select Apply. Now you can see the selections Movebank has made between primary and alternate Argos locations.
- Next, select Manage Attributes from the upper left. A list of Available Attributes (left) and existing Data Point Attributes (right) will appear.
- Select Argos Valid Location Manual from the Available Attributes.
- Click on the -> arrow key in the middle of the window to add this attribute to your event data.
- Select Apply. The new attribute will appear in the table.
- Next, select one or more events from either the map (points) or table (rows) for which you want to override the current selection between the two Argos locations (hold down Shift to select multiple consecutive locations in the table).
- Click in the cell in the Argos Valid Location Manual column of the table in the selected row (if you have selected multiple rows, you can click on the cell in any of the selected rows).
- Enter the value "1" to use the primary Argos location and "2" to use the alternate location. If only one row is selected, simply enter "1" or "2". If multiple rows are selected, check the box next to batch edit and then enter "1" or "2".
- Repeat steps as necessary.
- Select Save to finish.
Quality control of uploaded data
Define deployments and outliers
Event Editor